JohnHancock JHS full analysis,charts,indicators,moving averages,SMA,DMA,EMA,ADX,MACD,RSIJohn Hancock JHS WideScreen charts, DMA,SMA,EMA technical analysis, forecast prediction, by indicators ADX,MACD,RSI,CCI NYSE stock exchange
operates under N A sector & deals in N A
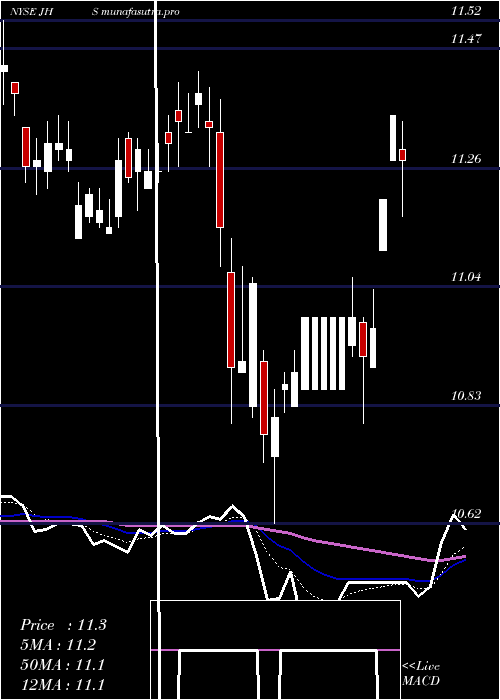
Daily price and charts and targets JohnHancock Strong Daily Stock price targets for JohnHancock JHS are 11.62 and 11.72 | Daily Target 1 | 11.59 | | Daily Target 2 | 11.65 | | Daily Target 3 | 11.693333333333 | | Daily Target 4 | 11.75 | | Daily Target 5 | 11.79 |
Daily price and volume John Hancock
| Date |
Closing |
Open |
Range |
Volume |
Thu 04 December 2025 |
11.70 (0.09%) |
11.74 |
11.64 - 11.74 |
1.1943 times |
Wed 03 December 2025 |
11.69 (0.09%) |
11.72 |
11.61 - 11.78 |
2.1178 times |
Tue 02 December 2025 |
11.68 (0.26%) |
11.74 |
11.59 - 11.74 |
2.3408 times |
Mon 01 December 2025 |
11.65 (-1.85%) |
11.85 |
11.55 - 11.85 |
1.7197 times |
Fri 28 November 2025 |
11.87 (0.42%) |
11.87 |
11.81 - 11.90 |
0.3503 times |
Wed 26 November 2025 |
11.82 (0.08%) |
11.81 |
11.72 - 11.89 |
0.4777 times |
Tue 25 November 2025 |
11.81 (0.85%) |
11.79 |
11.75 - 11.81 |
0.3503 times |
Mon 24 November 2025 |
11.71 (0%) |
11.71 |
11.52 - 11.74 |
0.621 times |
Fri 21 November 2025 |
11.71 (0.95%) |
11.68 |
11.62 - 11.71 |
0.3025 times |
Thu 20 November 2025 |
11.60 (-0.6%) |
11.77 |
11.60 - 11.78 |
0.5255 times |
Wed 19 November 2025 |
11.67 (0.26%) |
11.67 |
11.64 - 11.70 |
0.6847 times |
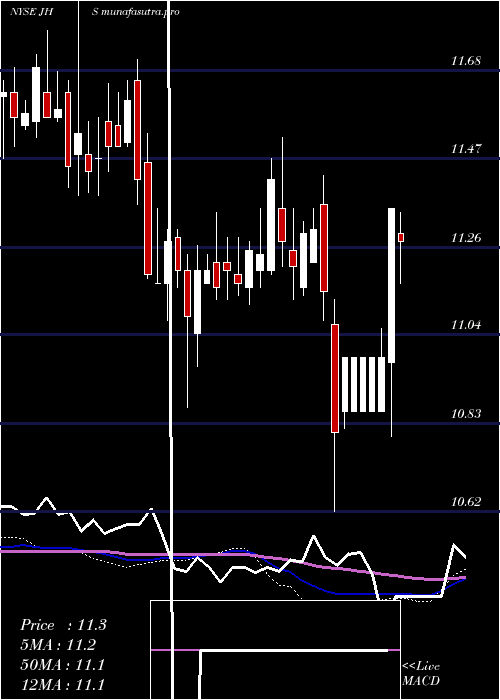
Weekly price and charts JohnHancock Strong weekly Stock price targets for JohnHancock JHS are 11.48 and 11.78 | Weekly Target 1 | 11.4 | | Weekly Target 2 | 11.55 | | Weekly Target 3 | 11.7 | | Weekly Target 4 | 11.85 | | Weekly Target 5 | 12 |
Weekly price and volumes for John Hancock
| Date |
Closing |
Open |
Range |
Volume |
Thu 04 December 2025 |
11.70 (-1.43%) |
11.85 |
11.55 - 11.85 |
0.8223 times |
Fri 28 November 2025 |
11.87 (1.37%) |
11.71 |
11.52 - 11.90 |
0.2007 times |
Fri 21 November 2025 |
11.71 (1.21%) |
11.62 |
11.56 - 11.78 |
1.6411 times |
Fri 14 November 2025 |
11.57 (0.52%) |
11.55 |
11.48 - 11.67 |
1.0497 times |
Fri 07 November 2025 |
11.51 (-0.26%) |
11.53 |
11.45 - 11.62 |
0.92 times |
Fri 31 October 2025 |
11.54 (0%) |
11.56 |
11.54 - 11.60 |
0.1012 times |
Fri 31 October 2025 |
11.54 (-0.69%) |
11.66 |
11.50 - 11.70 |
1.0124 times |
Fri 24 October 2025 |
11.62 (-2.11%) |
11.90 |
11.54 - 11.93 |
3.5309 times |
Fri 17 October 2025 |
11.87 (0.85%) |
11.96 |
11.76 - 12.08 |
0.524 times |
Tue 07 October 2025 |
11.77 (-0.25%) |
11.80 |
11.70 - 11.80 |
0.1976 times |
Fri 03 October 2025 |
11.80 (0.77%) |
11.78 |
11.62 - 11.80 |
0.8009 times |
Monthly price and charts JohnHancock Strong monthly Stock price targets for JohnHancock JHS are 11.48 and 11.78 | Monthly Target 1 | 11.4 | | Monthly Target 2 | 11.55 | | Monthly Target 3 | 11.7 | | Monthly Target 4 | 11.85 | | Monthly Target 5 | 12 |
Monthly price and volumes John Hancock
| Date |
Closing |
Open |
Range |
Volume |
Thu 04 December 2025 |
11.70 (-1.43%) |
11.85 |
11.55 - 11.85 |
0.1849 times |
Fri 28 November 2025 |
11.87 (2.86%) |
11.53 |
11.45 - 11.90 |
0.8572 times |
Fri 31 October 2025 |
11.54 (-1.2%) |
11.71 |
11.50 - 12.08 |
1.325 times |
Tue 30 September 2025 |
11.68 (0.86%) |
11.54 |
11.38 - 11.95 |
1.2315 times |
Fri 29 August 2025 |
11.58 (2.12%) |
11.40 |
11.35 - 11.67 |
0.7741 times |
Thu 31 July 2025 |
11.34 (0.53%) |
11.26 |
11.17 - 11.45 |
0.952 times |
Mon 30 June 2025 |
11.28 (0%) |
11.17 |
11.03 - 11.35 |
1.4212 times |
Fri 30 May 2025 |
11.28 (-0.7%) |
11.32 |
11.01 - 11.47 |
1.1111 times |
Wed 30 April 2025 |
11.36 (0.18%) |
11.32 |
10.62 - 11.43 |
0.9881 times |
Mon 31 March 2025 |
11.34 (-0.7%) |
11.35 |
11.13 - 11.52 |
1.1548 times |
Fri 28 February 2025 |
11.42 (1.96%) |
11.19 |
11.12 - 11.47 |
1.5447 times |

DMA SMA EMA moving averages of John Hancock JHS
DMA (daily moving average) of John Hancock JHS
| DMA period | DMA value | | 5 day DMA | 11.72 | | 12 day DMA | 11.71 | | 20 day DMA | 11.65 | | 35 day DMA | 11.65 | | 50 day DMA | 11.68 | | 100 day DMA | 11.58 | | 150 day DMA | 11.46 | | 200 day DMA | 11.39 | EMA (exponential moving average) of John Hancock JHS
| EMA period | EMA current | EMA prev | EMA prev2 | | 5 day EMA | 11.71 | 11.71 | 11.72 | | 12 day EMA | 11.7 | 11.7 | 11.7 | | 20 day EMA | 11.7 | 11.7 | 11.7 | | 35 day EMA | 11.67 | 11.67 | 11.67 | | 50 day EMA | 11.69 | 11.69 | 11.69 |
SMA (simple moving average) of John Hancock JHS
| SMA period | SMA current | SMA prev | SMA prev2 | | 5 day SMA | 11.72 | 11.74 | 11.77 | | 12 day SMA | 11.71 | 11.71 | 11.7 | | 20 day SMA | 11.65 | 11.64 | 11.63 | | 35 day SMA | 11.65 | 11.65 | 11.66 | | 50 day SMA | 11.68 | 11.68 | 11.68 | | 100 day SMA | 11.58 | 11.57 | 11.57 | | 150 day SMA | 11.46 | 11.46 | 11.45 | | 200 day SMA | 11.39 | 11.39 | 11.38 |
|
|
