NuveenFloating JFR full analysis,charts,indicators,moving averages,SMA,DMA,EMA,ADX,MACD,RSINuveen Floating JFR WideScreen charts, DMA,SMA,EMA technical analysis, forecast prediction, by indicators ADX,MACD,RSI,CCI NYSE stock exchange
operates under N A sector & deals in N A
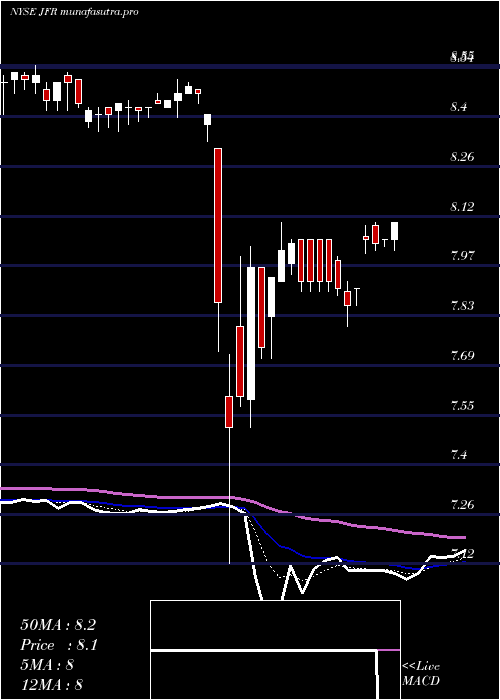
Daily price and charts and targets NuveenFloating Strong Daily Stock price targets for NuveenFloating JFR are 7.73 and 7.79 | Daily Target 1 | 7.72 | | Daily Target 2 | 7.74 | | Daily Target 3 | 7.7766666666667 | | Daily Target 4 | 7.8 | | Daily Target 5 | 7.84 |
Daily price and volume Nuveen Floating
| Date |
Closing |
Open |
Range |
Volume |
Mon 20 October 2025 |
7.77 (0%) |
7.79 |
7.75 - 7.81 |
0.9886 times |
Fri 17 October 2025 |
7.77 (-0.38%) |
7.81 |
7.71 - 7.83 |
1.5951 times |
Thu 16 October 2025 |
7.80 (-1.39%) |
7.91 |
7.78 - 7.94 |
1.4094 times |
Wed 15 October 2025 |
7.91 (-1%) |
7.88 |
7.88 - 7.96 |
0.784 times |
Tue 14 October 2025 |
7.99 (-0.75%) |
8.04 |
7.97 - 8.04 |
0.8105 times |
Mon 13 October 2025 |
8.05 (-0.49%) |
8.09 |
7.99 - 8.10 |
0.9443 times |
Tue 07 October 2025 |
8.09 (0.5%) |
8.06 |
8.05 - 8.10 |
0.8879 times |
Mon 06 October 2025 |
8.05 (-0.37%) |
8.12 |
8.03 - 8.13 |
0.8615 times |
Fri 03 October 2025 |
8.08 (-0.37%) |
8.11 |
8.08 - 8.12 |
0.9794 times |
Thu 02 October 2025 |
8.11 (-0.49%) |
8.15 |
8.11 - 8.17 |
0.7393 times |
Wed 01 October 2025 |
8.15 (-0.37%) |
8.19 |
8.13 - 8.19 |
0.8976 times |
Weekly price and charts NuveenFloating Strong weekly Stock price targets for NuveenFloating JFR are 7.73 and 7.79 | Weekly Target 1 | 7.72 | | Weekly Target 2 | 7.74 | | Weekly Target 3 | 7.7766666666667 | | Weekly Target 4 | 7.8 | | Weekly Target 5 | 7.84 |
Weekly price and volumes for Nuveen Floating
| Date |
Closing |
Open |
Range |
Volume |
Mon 20 October 2025 |
7.77 (0%) |
7.79 |
7.75 - 7.81 |
0.3186 times |
Fri 17 October 2025 |
7.77 (-3.96%) |
8.09 |
7.71 - 8.10 |
1.7863 times |
Tue 07 October 2025 |
8.09 (0.12%) |
8.12 |
8.03 - 8.13 |
0.5637 times |
Fri 03 October 2025 |
8.08 (0.12%) |
8.09 |
8.02 - 8.19 |
1.7115 times |
Fri 26 September 2025 |
8.07 (-1.82%) |
8.24 |
8.05 - 8.24 |
1.4554 times |
Fri 19 September 2025 |
8.22 (-2.03%) |
8.35 |
8.21 - 8.35 |
1.0874 times |
Fri 12 September 2025 |
8.39 (-0.59%) |
8.42 |
8.36 - 8.45 |
1.1216 times |
Fri 05 September 2025 |
8.44 (-0.12%) |
8.44 |
8.38 - 8.45 |
0.8623 times |
Fri 29 August 2025 |
8.45 (0%) |
8.41 |
8.39 - 8.45 |
0.2116 times |
Fri 29 August 2025 |
8.45 (0.84%) |
8.41 |
8.38 - 8.45 |
0.8817 times |
Fri 22 August 2025 |
8.38 (-0.24%) |
8.41 |
8.35 - 8.45 |
1.2243 times |
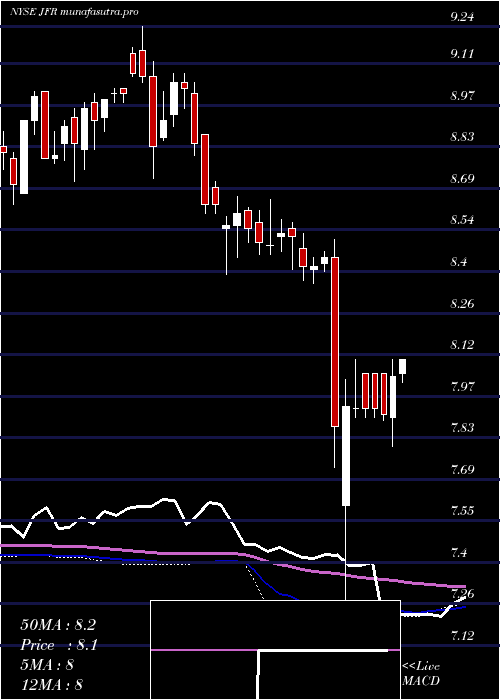
Monthly price and charts NuveenFloating Strong monthly Stock price targets for NuveenFloating JFR are 7.5 and 7.98 | Monthly Target 1 | 7.41 | | Monthly Target 2 | 7.59 | | Monthly Target 3 | 7.89 | | Monthly Target 4 | 8.07 | | Monthly Target 5 | 8.37 |
Monthly price and volumes Nuveen Floating
| Date |
Closing |
Open |
Range |
Volume |
Mon 20 October 2025 |
7.77 (-5.01%) |
8.19 |
7.71 - 8.19 |
0.5902 times |
Tue 30 September 2025 |
8.18 (-3.2%) |
8.44 |
8.02 - 8.45 |
0.9067 times |
Fri 29 August 2025 |
8.45 (-0.82%) |
8.53 |
8.35 - 8.55 |
0.7432 times |
Thu 31 July 2025 |
8.52 (0.59%) |
8.48 |
8.40 - 8.59 |
0.7283 times |
Mon 30 June 2025 |
8.47 (2.42%) |
8.29 |
8.23 - 8.47 |
0.6665 times |
Fri 30 May 2025 |
8.27 (1.1%) |
8.19 |
8.11 - 8.30 |
0.6315 times |
Wed 30 April 2025 |
8.18 (-3.42%) |
8.47 |
7.12 - 8.50 |
1.0856 times |
Mon 31 March 2025 |
8.47 (-0.7%) |
8.55 |
8.36 - 8.57 |
1.2269 times |
Fri 28 February 2025 |
8.53 (-0.81%) |
8.61 |
8.46 - 8.65 |
1.6968 times |
Fri 31 January 2025 |
8.60 (-3.59%) |
8.98 |
8.39 - 9.08 |
1.7242 times |
Tue 31 December 2024 |
8.92 (-1%) |
9.15 |
8.72 - 9.24 |
0.6978 times |

DMA SMA EMA moving averages of Nuveen Floating JFR
DMA (daily moving average) of Nuveen Floating JFR
| DMA period | DMA value | | 5 day DMA | 7.85 | | 12 day DMA | 8 | | 20 day DMA | 8.07 | | 35 day DMA | 8.2 | | 50 day DMA | 8.28 | | 100 day DMA | 8.34 | | 150 day DMA | 8.28 | | 200 day DMA | 8.37 | EMA (exponential moving average) of Nuveen Floating JFR
| EMA period | EMA current | EMA prev | EMA prev2 | | 5 day EMA | 7.84 | 7.88 | 7.93 | | 12 day EMA | 7.96 | 7.99 | 8.03 | | 20 day EMA | 8.05 | 8.08 | 8.11 | | 35 day EMA | 8.16 | 8.18 | 8.2 | | 50 day EMA | 8.25 | 8.27 | 8.29 |
SMA (simple moving average) of Nuveen Floating JFR
| SMA period | SMA current | SMA prev | SMA prev2 | | 5 day SMA | 7.85 | 7.9 | 7.97 | | 12 day SMA | 8 | 8.02 | 8.05 | | 20 day SMA | 8.07 | 8.09 | 8.12 | | 35 day SMA | 8.2 | 8.22 | 8.24 | | 50 day SMA | 8.28 | 8.29 | 8.31 | | 100 day SMA | 8.34 | 8.34 | 8.35 | | 150 day SMA | 8.28 | 8.29 | 8.29 | | 200 day SMA | 8.37 | 8.37 | 8.38 |
|
|
