JefferiesFinancial JEF full analysis,charts,indicators,moving averages,SMA,DMA,EMA,ADX,MACD,RSIJefferies Financial JEF WideScreen charts, DMA,SMA,EMA technical analysis, forecast prediction, by indicators ADX,MACD,RSI,CCI NYSE stock exchange
operates under Consumer Non Durables sector & deals in Meat Poultry Fish
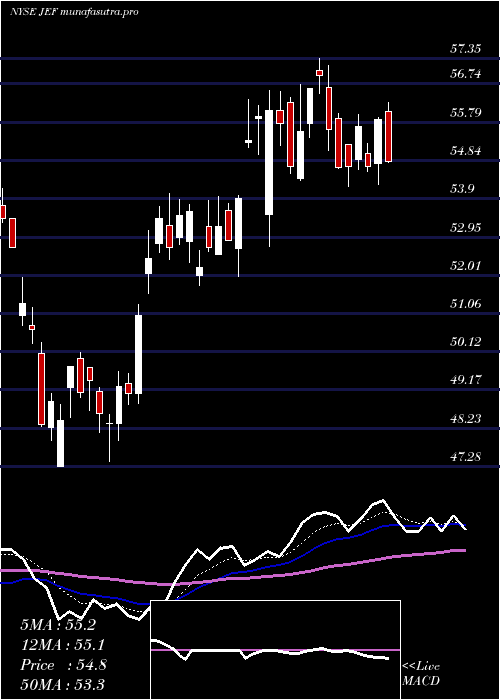
Daily price and charts and targets JefferiesFinancial Strong Daily Stock price targets for JefferiesFinancial JEF are 58.77 and 60.45 | Daily Target 1 | 57.53 | | Daily Target 2 | 58.32 | | Daily Target 3 | 59.206666666667 | | Daily Target 4 | 60 | | Daily Target 5 | 60.89 |
Daily price and volume Jefferies Financial
| Date |
Closing |
Open |
Range |
Volume |
Fri 05 December 2025 |
59.12 (0.51%) |
58.73 |
58.41 - 60.09 |
1.0775 times |
Thu 04 December 2025 |
58.82 (0.7%) |
58.73 |
58.37 - 60.06 |
0.8796 times |
Wed 03 December 2025 |
58.41 (2.85%) |
56.91 |
56.71 - 58.50 |
0.7393 times |
Tue 02 December 2025 |
56.79 (-0.23%) |
57.49 |
55.98 - 57.49 |
0.9358 times |
Mon 01 December 2025 |
56.92 (-1.11%) |
56.95 |
55.99 - 57.49 |
1.4147 times |
Fri 28 November 2025 |
57.56 (0.58%) |
57.15 |
56.40 - 57.61 |
0.7661 times |
Wed 26 November 2025 |
57.23 (0.67%) |
57.01 |
56.91 - 58.25 |
0.9959 times |
Tue 25 November 2025 |
56.85 (2.73%) |
55.62 |
55.30 - 57.30 |
1.0044 times |
Mon 24 November 2025 |
55.34 (1.28%) |
54.79 |
54.61 - 55.51 |
0.9939 times |
Fri 21 November 2025 |
54.64 (1.86%) |
53.84 |
53.09 - 55.14 |
1.1927 times |
Thu 20 November 2025 |
53.64 (-2.05%) |
56.15 |
53.47 - 59.08 |
1.683 times |
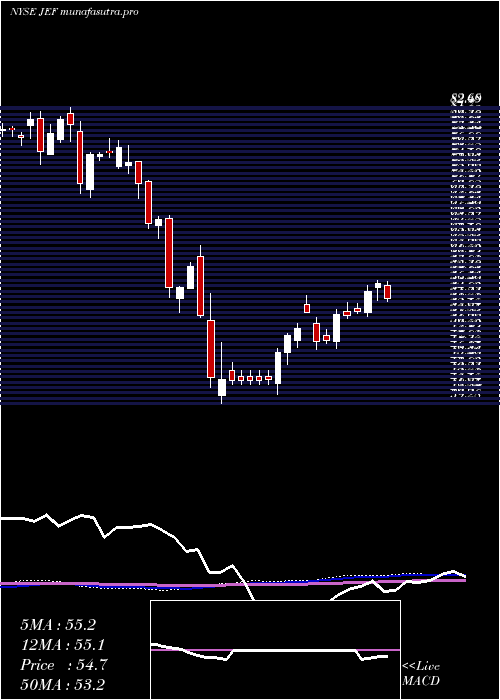
Weekly price and charts JefferiesFinancial Strong weekly Stock price targets for JefferiesFinancial JEF are 57.55 and 61.66 | Weekly Target 1 | 54.29 | | Weekly Target 2 | 56.7 | | Weekly Target 3 | 58.396666666667 | | Weekly Target 4 | 60.81 | | Weekly Target 5 | 62.51 |
Weekly price and volumes for Jefferies Financial
| Date |
Closing |
Open |
Range |
Volume |
Fri 05 December 2025 |
59.12 (2.71%) |
56.95 |
55.98 - 60.09 |
0.7195 times |
Fri 28 November 2025 |
57.56 (5.34%) |
54.79 |
54.61 - 58.25 |
0.5361 times |
Fri 21 November 2025 |
54.64 (-1.53%) |
54.84 |
51.51 - 59.08 |
0.9625 times |
Fri 14 November 2025 |
55.49 (1.8%) |
55.17 |
54.17 - 59.42 |
1.1292 times |
Fri 07 November 2025 |
54.51 (3.18%) |
52.01 |
51.03 - 54.82 |
0.583 times |
Fri 31 October 2025 |
52.83 (0%) |
52.74 |
51.87 - 52.94 |
0.1881 times |
Fri 31 October 2025 |
52.83 (-6.99%) |
57.09 |
51.87 - 57.50 |
0.9493 times |
Fri 24 October 2025 |
56.80 (9.86%) |
52.19 |
52.10 - 57.57 |
1.5655 times |
Fri 17 October 2025 |
51.70 (-12.52%) |
53.01 |
48.51 - 55.33 |
2.9525 times |
Tue 07 October 2025 |
59.10 (-5.33%) |
62.80 |
59.08 - 63.07 |
0.4142 times |
Fri 03 October 2025 |
62.43 (-6.42%) |
67.25 |
62.18 - 69.93 |
1.3907 times |
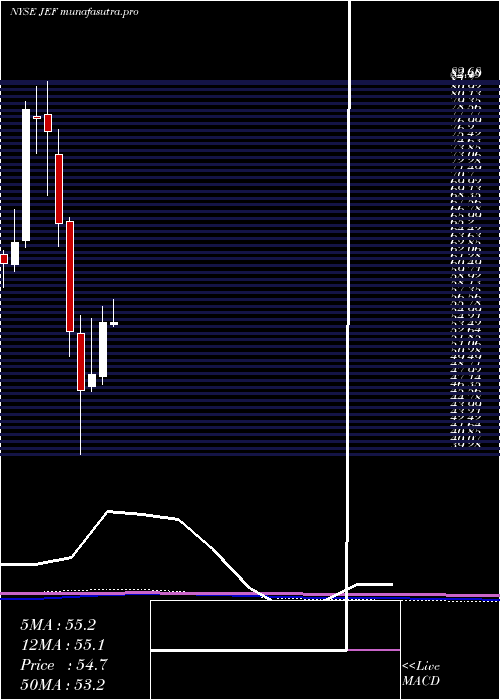
Monthly price and charts JefferiesFinancial Strong monthly Stock price targets for JefferiesFinancial JEF are 57.55 and 61.66 | Monthly Target 1 | 54.29 | | Monthly Target 2 | 56.7 | | Monthly Target 3 | 58.396666666667 | | Monthly Target 4 | 60.81 | | Monthly Target 5 | 62.51 |
Monthly price and volumes Jefferies Financial
| Date |
Closing |
Open |
Range |
Volume |
Fri 05 December 2025 |
59.12 (2.71%) |
56.95 |
55.98 - 60.09 |
0.1907 times |
Fri 28 November 2025 |
57.56 (8.95%) |
52.01 |
51.03 - 59.42 |
0.8509 times |
Fri 31 October 2025 |
52.83 (-19.24%) |
64.84 |
48.51 - 65.32 |
1.7798 times |
Tue 30 September 2025 |
65.42 (0.88%) |
63.72 |
62.60 - 71.04 |
1.1017 times |
Fri 29 August 2025 |
64.85 (12.47%) |
55.99 |
54.47 - 65.66 |
0.8544 times |
Thu 31 July 2025 |
57.66 (5.43%) |
54.40 |
53.96 - 59.73 |
0.8724 times |
Mon 30 June 2025 |
54.69 (12.53%) |
48.34 |
47.41 - 56.56 |
1.183 times |
Fri 30 May 2025 |
48.60 (4%) |
47.19 |
46.64 - 55.09 |
0.7481 times |
Wed 30 April 2025 |
46.73 (-12.77%) |
53.36 |
39.28 - 55.48 |
1.1287 times |
Mon 31 March 2025 |
53.57 (-19.08%) |
66.43 |
50.67 - 66.85 |
1.2904 times |
Fri 28 February 2025 |
66.20 (-13.9%) |
74.18 |
63.53 - 77.12 |
0.8139 times |
DMA SMA EMA moving averages of Jefferies Financial JEF
DMA (daily moving average) of Jefferies Financial JEF
| DMA period | DMA value | | 5 day DMA | 58.01 | | 12 day DMA | 56.67 | | 20 day DMA | 56.16 | | 35 day DMA | 55.28 | | 50 day DMA | 57.09 | | 100 day DMA | 59.22 | | 150 day DMA | 56.81 | | 200 day DMA | 56.01 | EMA (exponential moving average) of Jefferies Financial JEF
| EMA period | EMA current | EMA prev | EMA prev2 | | 5 day EMA | 58.23 | 57.79 | 57.27 | | 12 day EMA | 57.13 | 56.77 | 56.4 | | 20 day EMA | 56.69 | 56.43 | 56.18 | | 35 day EMA | 57.37 | 57.27 | 57.18 | | 50 day EMA | 58.12 | 58.08 | 58.05 |
SMA (simple moving average) of Jefferies Financial JEF
| SMA period | SMA current | SMA prev | SMA prev2 | | 5 day SMA | 58.01 | 57.7 | 57.38 | | 12 day SMA | 56.67 | 56.18 | 55.66 | | 20 day SMA | 56.16 | 55.87 | 55.63 | | 35 day SMA | 55.28 | 54.98 | 54.86 | | 50 day SMA | 57.09 | 57.3 | 57.51 | | 100 day SMA | 59.22 | 59.17 | 59.14 | | 150 day SMA | 56.81 | 56.73 | 56.65 | | 200 day SMA | 56.01 | 56.07 | 56.13 |
|
|
