JohnsonControls JCI full analysis,charts,indicators,moving averages,SMA,DMA,EMA,ADX,MACD,RSIJohnson Controls JCI WideScreen charts, DMA,SMA,EMA technical analysis, forecast prediction, by indicators ADX,MACD,RSI,CCI NYSE stock exchange
operates under Consumer Services sector & deals in Other Consumer Services
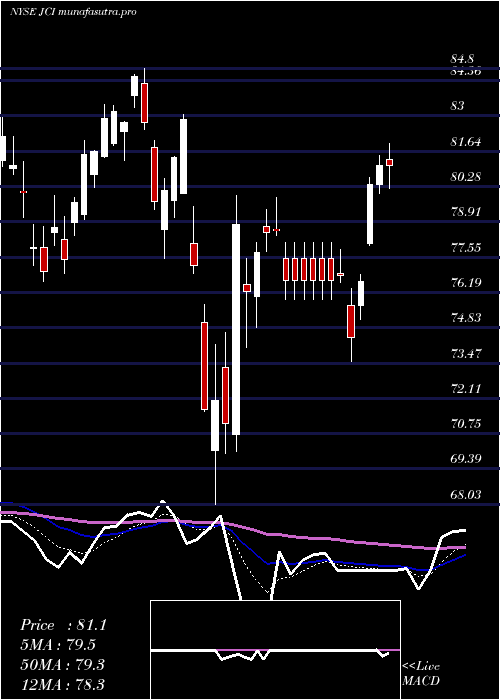
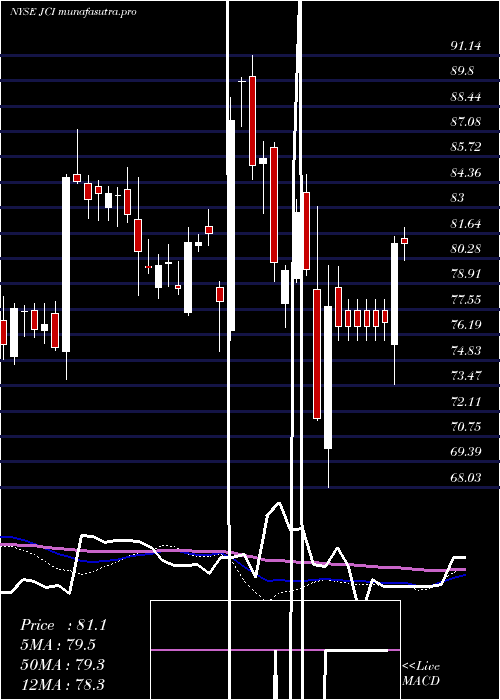
Daily price and charts and targets JohnsonControls Strong Daily Stock price targets for JohnsonControls JCI are 113.6 and 115.76 | Daily Target 1 | 111.96 | | Daily Target 2 | 113.08 | | Daily Target 3 | 114.12 | | Daily Target 4 | 115.24 | | Daily Target 5 | 116.28 |
Daily price and volume Johnson Controls
| Date |
Closing |
Open |
Range |
Volume |
Thu 04 December 2025 |
114.20 (-0.02%) |
113.61 |
113.00 - 115.16 |
0.9573 times |
Wed 03 December 2025 |
114.22 (-0.92%) |
115.00 |
113.47 - 115.40 |
1.0802 times |
Tue 02 December 2025 |
115.28 (0.3%) |
115.34 |
114.58 - 115.74 |
0.8285 times |
Mon 01 December 2025 |
114.94 (-1.18%) |
115.41 |
114.77 - 116.12 |
0.7453 times |
Fri 28 November 2025 |
116.31 (0.02%) |
116.88 |
115.43 - 117.26 |
0.2988 times |
Wed 26 November 2025 |
116.29 (1.43%) |
114.69 |
114.55 - 117.18 |
0.7468 times |
Tue 25 November 2025 |
114.65 (0.4%) |
114.76 |
112.57 - 115.50 |
1.3614 times |
Mon 24 November 2025 |
114.19 (0.56%) |
114.08 |
113.55 - 115.52 |
1.3765 times |
Fri 21 November 2025 |
113.55 (0.5%) |
113.06 |
112.21 - 114.31 |
1.0964 times |
Thu 20 November 2025 |
112.99 (-1.25%) |
116.30 |
112.83 - 117.32 |
1.5087 times |
Wed 19 November 2025 |
114.42 (-0.02%) |
114.40 |
114.11 - 116.37 |
0.918 times |
Weekly price and charts JohnsonControls Strong weekly Stock price targets for JohnsonControls JCI are 112.04 and 115.16 | Weekly Target 1 | 111.32 | | Weekly Target 2 | 112.76 | | Weekly Target 3 | 114.44 | | Weekly Target 4 | 115.88 | | Weekly Target 5 | 117.56 |
Weekly price and volumes for Johnson Controls
| Date |
Closing |
Open |
Range |
Volume |
Thu 04 December 2025 |
114.20 (-1.81%) |
115.41 |
113.00 - 116.12 |
0.9929 times |
Fri 28 November 2025 |
116.31 (2.43%) |
114.08 |
112.57 - 117.26 |
1.0403 times |
Fri 21 November 2025 |
113.55 (-4.35%) |
118.49 |
112.21 - 119.08 |
1.5062 times |
Fri 14 November 2025 |
118.72 (-2.89%) |
122.75 |
118.00 - 123.78 |
1.3355 times |
Fri 07 November 2025 |
122.25 (6.87%) |
112.00 |
110.70 - 123.37 |
1.6417 times |
Fri 31 October 2025 |
114.39 (0%) |
113.80 |
113.80 - 115.16 |
0.2176 times |
Fri 31 October 2025 |
114.39 (1.28%) |
114.07 |
111.54 - 116.48 |
0.9959 times |
Fri 24 October 2025 |
112.94 (3.78%) |
109.86 |
107.84 - 113.38 |
0.9784 times |
Fri 17 October 2025 |
108.83 (0.48%) |
106.69 |
104.49 - 111.45 |
1.0006 times |
Tue 07 October 2025 |
108.31 (-0.44%) |
109.58 |
107.67 - 111.22 |
0.2908 times |
Fri 03 October 2025 |
108.79 (1.66%) |
108.24 |
107.25 - 110.25 |
0.9682 times |
Monthly price and charts JohnsonControls Strong monthly Stock price targets for JohnsonControls JCI are 112.04 and 115.16 | Monthly Target 1 | 111.32 | | Monthly Target 2 | 112.76 | | Monthly Target 3 | 114.44 | | Monthly Target 4 | 115.88 | | Monthly Target 5 | 117.56 |
Monthly price and volumes Johnson Controls
| Date |
Closing |
Open |
Range |
Volume |
Thu 04 December 2025 |
114.20 (-1.81%) |
115.41 |
113.00 - 116.12 |
0.1986 times |
Fri 28 November 2025 |
116.31 (1.68%) |
112.00 |
110.70 - 123.78 |
1.1049 times |
Fri 31 October 2025 |
114.39 (4.04%) |
109.12 |
104.49 - 116.48 |
0.8191 times |
Tue 30 September 2025 |
109.95 (2.86%) |
105.06 |
103.82 - 110.33 |
1.0012 times |
Fri 29 August 2025 |
106.89 (1.8%) |
104.27 |
103.07 - 110.35 |
1.2633 times |
Thu 31 July 2025 |
105.00 (-0.59%) |
105.22 |
102.09 - 112.63 |
1.2493 times |
Mon 30 June 2025 |
105.62 (4.19%) |
100.90 |
99.11 - 105.89 |
1.009 times |
Fri 30 May 2025 |
101.37 (20.82%) |
84.65 |
84.61 - 102.36 |
1.2315 times |
Wed 30 April 2025 |
83.90 (4.73%) |
79.72 |
68.03 - 84.02 |
1.0495 times |
Mon 31 March 2025 |
80.11 (-6.48%) |
86.23 |
76.60 - 86.50 |
1.0735 times |
Fri 28 February 2025 |
85.66 (9.82%) |
76.44 |
75.89 - 91.14 |
1.1418 times |

DMA SMA EMA moving averages of Johnson Controls JCI
DMA (daily moving average) of Johnson Controls JCI
| DMA period | DMA value | | 5 day DMA | 114.99 | | 12 day DMA | 114.62 | | 20 day DMA | 117.12 | | 35 day DMA | 115.08 | | 50 day DMA | 113.05 | | 100 day DMA | 109.96 | | 150 day DMA | 106.32 | | 200 day DMA | 99.79 | EMA (exponential moving average) of Johnson Controls JCI
| EMA period | EMA current | EMA prev | EMA prev2 | | 5 day EMA | 114.7 | 114.95 | 115.32 | | 12 day EMA | 115.23 | 115.42 | 115.64 | | 20 day EMA | 115.31 | 115.43 | 115.56 | | 35 day EMA | 114.29 | 114.3 | 114.3 | | 50 day EMA | 112.82 | 112.76 | 112.7 |
SMA (simple moving average) of Johnson Controls JCI
| SMA period | SMA current | SMA prev | SMA prev2 | | 5 day SMA | 114.99 | 115.41 | 115.49 | | 12 day SMA | 114.62 | 114.81 | 115.18 | | 20 day SMA | 117.12 | 117.46 | 117.3 | | 35 day SMA | 115.08 | 114.99 | 114.81 | | 50 day SMA | 113.05 | 112.93 | 112.82 | | 100 day SMA | 109.96 | 109.88 | 109.8 | | 150 day SMA | 106.32 | 106.1 | 105.88 | | 200 day SMA | 99.79 | 99.67 | 99.54 |
|
|
