NuveenCore JCE full analysis,charts,indicators,moving averages,SMA,DMA,EMA,ADX,MACD,RSINuveen Core JCE WideScreen charts, DMA,SMA,EMA technical analysis, forecast prediction, by indicators ADX,MACD,RSI,CCI NYSE stock exchange
operates under N A sector & deals in N A
Daily price and charts and targets NuveenCore Strong Daily Stock price targets for NuveenCore JCE are 15.89 and 16.03 | Daily Target 1 | 15.78 | | Daily Target 2 | 15.86 | | Daily Target 3 | 15.923333333333 | | Daily Target 4 | 16 | | Daily Target 5 | 16.06 |
Daily price and volume Nuveen Core
| Date |
Closing |
Open |
Range |
Volume |
Thu 04 December 2025 |
15.93 (0.13%) |
15.88 |
15.85 - 15.99 |
0.8127 times |
Wed 03 December 2025 |
15.91 (-0.06%) |
15.92 |
15.83 - 15.96 |
0.5858 times |
Tue 02 December 2025 |
15.92 (0.19%) |
15.90 |
15.85 - 15.96 |
0.9313 times |
Mon 01 December 2025 |
15.89 (-0.38%) |
15.79 |
15.79 - 15.95 |
0.8026 times |
Fri 28 November 2025 |
15.95 (0.76%) |
15.87 |
15.78 - 15.95 |
0.7179 times |
Wed 26 November 2025 |
15.83 (0.89%) |
15.75 |
15.74 - 15.89 |
1.0159 times |
Tue 25 November 2025 |
15.69 (0.13%) |
15.63 |
15.57 - 15.80 |
2.0047 times |
Mon 24 November 2025 |
15.67 (1.89%) |
15.47 |
15.47 - 15.75 |
0.7653 times |
Fri 21 November 2025 |
15.38 (0.79%) |
15.26 |
15.22 - 15.49 |
0.8872 times |
Thu 20 November 2025 |
15.26 (-1.17%) |
15.55 |
15.24 - 15.76 |
1.4765 times |
Wed 19 November 2025 |
15.44 (-0.52%) |
15.53 |
15.30 - 15.70 |
1.253 times |
Weekly price and charts NuveenCore Strong weekly Stock price targets for NuveenCore JCE are 15.86 and 16.06 | Weekly Target 1 | 15.7 | | Weekly Target 2 | 15.82 | | Weekly Target 3 | 15.903333333333 | | Weekly Target 4 | 16.02 | | Weekly Target 5 | 16.1 |
Weekly price and volumes for Nuveen Core
| Date |
Closing |
Open |
Range |
Volume |
Thu 04 December 2025 |
15.93 (-0.13%) |
15.79 |
15.79 - 15.99 |
0.7147 times |
Fri 28 November 2025 |
15.95 (3.71%) |
15.47 |
15.47 - 15.95 |
1.0277 times |
Fri 21 November 2025 |
15.38 (-2.41%) |
15.72 |
15.22 - 15.93 |
1.2525 times |
Fri 14 November 2025 |
15.76 (0.38%) |
15.77 |
15.68 - 16.01 |
0.9017 times |
Fri 07 November 2025 |
15.70 (-1.75%) |
15.90 |
15.56 - 15.96 |
0.6869 times |
Fri 31 October 2025 |
15.98 (0%) |
15.96 |
15.82 - 15.98 |
0.2341 times |
Fri 31 October 2025 |
15.98 (1.01%) |
15.89 |
15.75 - 16.04 |
1.3236 times |
Fri 24 October 2025 |
15.82 (1.35%) |
15.61 |
15.51 - 15.86 |
0.8708 times |
Fri 17 October 2025 |
15.61 (0.58%) |
15.30 |
15.30 - 15.85 |
2.2145 times |
Tue 07 October 2025 |
15.52 (-0.7%) |
15.69 |
15.50 - 15.73 |
0.7734 times |
Fri 03 October 2025 |
15.63 (0.06%) |
15.64 |
15.45 - 15.94 |
2.338 times |
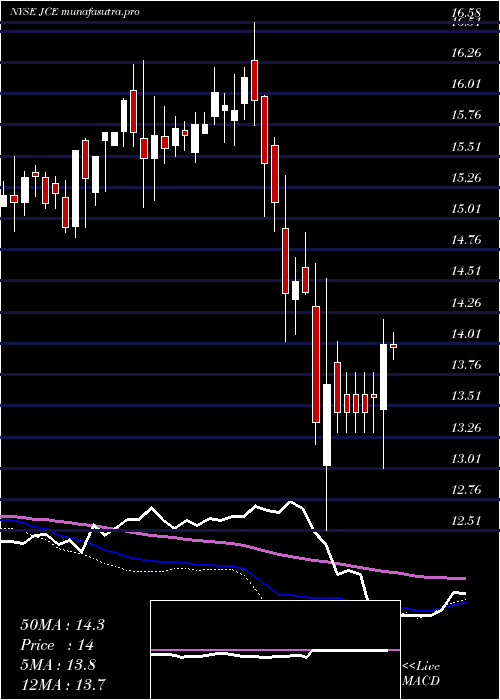
Monthly price and charts NuveenCore Strong monthly Stock price targets for NuveenCore JCE are 15.86 and 16.06 | Monthly Target 1 | 15.7 | | Monthly Target 2 | 15.82 | | Monthly Target 3 | 15.903333333333 | | Monthly Target 4 | 16.02 | | Monthly Target 5 | 16.1 |
Monthly price and volumes Nuveen Core
| Date |
Closing |
Open |
Range |
Volume |
Thu 04 December 2025 |
15.93 (-0.13%) |
15.79 |
15.79 - 15.99 |
0.1491 times |
Fri 28 November 2025 |
15.95 (-0.19%) |
15.90 |
15.22 - 16.01 |
0.8069 times |
Fri 31 October 2025 |
15.98 (1.59%) |
15.72 |
15.30 - 16.04 |
1.4113 times |
Tue 30 September 2025 |
15.73 (0%) |
15.59 |
15.23 - 16.00 |
1.3227 times |
Fri 29 August 2025 |
15.73 (2.01%) |
15.26 |
15.11 - 15.85 |
0.896 times |
Thu 31 July 2025 |
15.42 (-0.52%) |
15.55 |
15.31 - 15.69 |
1.0266 times |
Mon 30 June 2025 |
15.50 (3.13%) |
15.00 |
14.36 - 15.50 |
0.9626 times |
Fri 30 May 2025 |
15.03 (5.47%) |
14.33 |
14.21 - 15.50 |
0.8605 times |
Wed 30 April 2025 |
14.25 (-2.33%) |
14.64 |
12.51 - 14.96 |
1.6157 times |
Mon 31 March 2025 |
14.59 (-5.57%) |
15.60 |
14.03 - 15.66 |
0.9487 times |
Fri 28 February 2025 |
15.45 (-2.95%) |
15.80 |
15.03 - 16.58 |
0.7034 times |

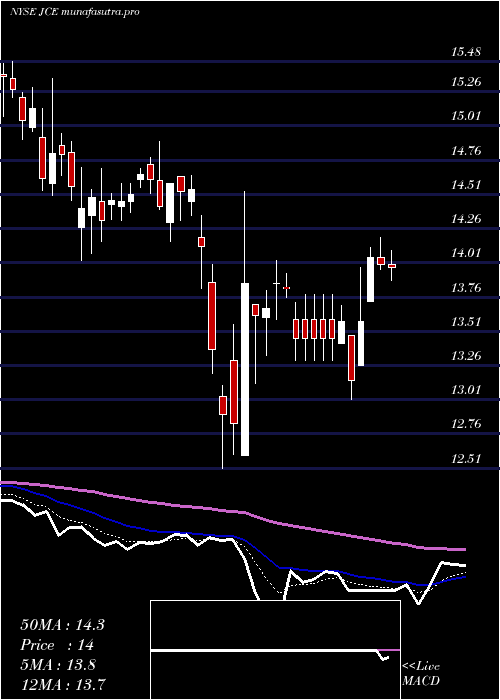
DMA SMA EMA moving averages of Nuveen Core JCE
DMA (daily moving average) of Nuveen Core JCE
| DMA period | DMA value | | 5 day DMA | 15.92 | | 12 day DMA | 15.7 | | 20 day DMA | 15.74 | | 35 day DMA | 15.75 | | 50 day DMA | 15.71 | | 100 day DMA | 15.64 | | 150 day DMA | 15.42 | | 200 day DMA | 15.19 | EMA (exponential moving average) of Nuveen Core JCE
| EMA period | EMA current | EMA prev | EMA prev2 | | 5 day EMA | 15.88 | 15.86 | 15.84 | | 12 day EMA | 15.8 | 15.78 | 15.76 | | 20 day EMA | 15.79 | 15.77 | 15.75 | | 35 day EMA | 15.72 | 15.71 | 15.7 | | 50 day EMA | 15.73 | 15.72 | 15.71 |
SMA (simple moving average) of Nuveen Core JCE
| SMA period | SMA current | SMA prev | SMA prev2 | | 5 day SMA | 15.92 | 15.9 | 15.86 | | 12 day SMA | 15.7 | 15.67 | 15.66 | | 20 day SMA | 15.74 | 15.74 | 15.74 | | 35 day SMA | 15.75 | 15.74 | 15.73 | | 50 day SMA | 15.71 | 15.71 | 15.7 | | 100 day SMA | 15.64 | 15.64 | 15.63 | | 150 day SMA | 15.42 | 15.41 | 15.39 | | 200 day SMA | 15.19 | 15.19 | 15.19 |
|
|
