JabilInc JBL full analysis,charts,indicators,moving averages,SMA,DMA,EMA,ADX,MACD,RSIJabil Inc JBL WideScreen charts, DMA,SMA,EMA technical analysis, forecast prediction, by indicators ADX,MACD,RSI,CCI NYSE stock exchange
operates under Technology sector & deals in Electrical Products
Daily price and charts and targets JabilInc Strong Daily Stock price targets for JabilInc JBL are 197.65 and 207.47 | Daily Target 1 | 195.52 | | Daily Target 2 | 199.77 | | Daily Target 3 | 205.34 | | Daily Target 4 | 209.59 | | Daily Target 5 | 215.16 |
Daily price and volume Jabil Inc
| Date |
Closing |
Open |
Range |
Volume |
Mon 20 October 2025 |
204.02 (-2.54%) |
210.40 |
201.09 - 210.91 |
1.1088 times |
Fri 17 October 2025 |
209.34 (-0.19%) |
207.52 |
205.86 - 210.01 |
0.9698 times |
Thu 16 October 2025 |
209.74 (1.38%) |
210.03 |
206.44 - 210.82 |
1.1147 times |
Wed 15 October 2025 |
206.88 (3.14%) |
203.80 |
202.79 - 208.07 |
0.9684 times |
Tue 14 October 2025 |
200.59 (0.35%) |
196.73 |
195.00 - 202.45 |
0.8814 times |
Mon 13 October 2025 |
199.90 (-1.34%) |
199.50 |
197.80 - 200.95 |
1.0746 times |
Tue 07 October 2025 |
202.62 (0.21%) |
204.87 |
199.50 - 205.88 |
1.1645 times |
Mon 06 October 2025 |
202.20 (-0.15%) |
203.77 |
202.19 - 208.54 |
0.8374 times |
Fri 03 October 2025 |
202.50 (-6.12%) |
216.01 |
201.65 - 217.77 |
1.1598 times |
Thu 02 October 2025 |
215.69 (0.4%) |
216.02 |
213.75 - 219.00 |
0.7205 times |
Wed 01 October 2025 |
214.84 (-1.07%) |
214.54 |
210.90 - 216.65 |
1.4181 times |
Weekly price and charts JabilInc Strong weekly Stock price targets for JabilInc JBL are 197.65 and 207.47 | Weekly Target 1 | 195.52 | | Weekly Target 2 | 199.77 | | Weekly Target 3 | 205.34 | | Weekly Target 4 | 209.59 | | Weekly Target 5 | 215.16 |
Weekly price and volumes for Jabil Inc
| Date |
Closing |
Open |
Range |
Volume |
Mon 20 October 2025 |
204.02 (-2.54%) |
210.40 |
201.09 - 210.91 |
0.2108 times |
Fri 17 October 2025 |
209.34 (3.32%) |
199.50 |
195.00 - 210.82 |
0.9524 times |
Tue 07 October 2025 |
202.62 (0.06%) |
203.77 |
199.50 - 208.54 |
0.3806 times |
Fri 03 October 2025 |
202.50 (-6.18%) |
218.50 |
201.65 - 220.53 |
1.1357 times |
Fri 26 September 2025 |
215.84 (-3.79%) |
224.42 |
203.55 - 237.14 |
2.1184 times |
Fri 19 September 2025 |
224.34 (4.8%) |
214.38 |
208.41 - 226.49 |
1.693 times |
Fri 12 September 2025 |
214.06 (1.88%) |
211.06 |
206.57 - 217.15 |
0.9149 times |
Fri 05 September 2025 |
210.10 (2.57%) |
199.76 |
196.93 - 212.58 |
0.9749 times |
Fri 29 August 2025 |
204.83 (0%) |
209.23 |
202.96 - 210.69 |
0.2935 times |
Fri 29 August 2025 |
204.83 (-2.39%) |
210.23 |
202.96 - 212.40 |
1.3257 times |
Fri 22 August 2025 |
209.84 (-2.55%) |
214.37 |
199.61 - 216.45 |
1.2714 times |
Monthly price and charts JabilInc Strong monthly Stock price targets for JabilInc JBL are 187.51 and 211.51 | Monthly Target 1 | 182.01 | | Monthly Target 2 | 193.01 | | Monthly Target 3 | 206.00666666667 | | Monthly Target 4 | 217.01 | | Monthly Target 5 | 230.01 |
Monthly price and volumes Jabil Inc
| Date |
Closing |
Open |
Range |
Volume |
Mon 20 October 2025 |
204.02 (-6.06%) |
214.54 |
195.00 - 219.00 |
0.4407 times |
Tue 30 September 2025 |
217.17 (6.02%) |
199.76 |
196.93 - 237.14 |
1.2607 times |
Fri 29 August 2025 |
204.83 (-8.22%) |
218.65 |
199.61 - 232.42 |
1.0578 times |
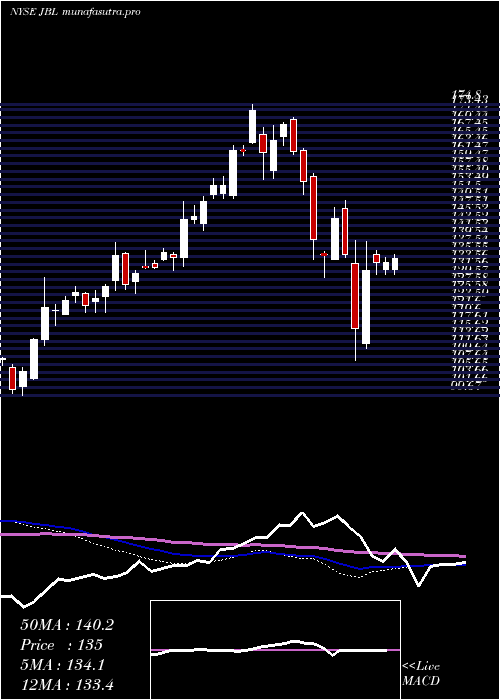
Thu 31 July 2025 |
223.17 (2.32%) |
218.01 |
212.30 - 232.84 |
1.036 times |
Mon 30 June 2025 |
218.10 (29.81%) |
167.30 |
164.69 - 219.00 |
1.3267 times |
Fri 30 May 2025 |
168.01 (14.64%) |
148.94 |
146.88 - 170.90 |
0.7487 times |
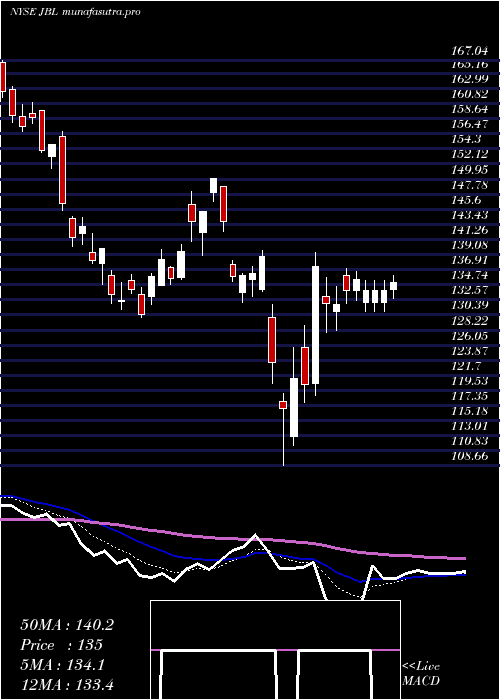
Wed 30 April 2025 |
146.56 (7.71%) |
135.57 |
108.66 - 148.62 |
1.116 times |
Mon 31 March 2025 |
136.07 (-12.17%) |
156.13 |
129.98 - 156.84 |
1.1039 times |
Fri 28 February 2025 |
154.92 (-4.61%) |
157.65 |
151.44 - 171.45 |
0.7427 times |
Fri 31 January 2025 |
162.41 (12.86%) |
144.53 |
142.47 - 174.80 |
1.1667 times |
Tue 31 December 2024 |
143.90 (8.42%) |
134.74 |
131.92 - 149.72 |
0.9419 times |

DMA SMA EMA moving averages of Jabil Inc JBL
DMA (daily moving average) of Jabil Inc JBL
| DMA period | DMA value | | 5 day DMA | 206.11 | | 12 day DMA | 207.12 | | 20 day DMA | 213.33 | | 35 day DMA | 211.86 | | 50 day DMA | 212.61 | | 100 day DMA | 208.36 | | 150 day DMA | 186.58 | | 200 day DMA | 179.38 | EMA (exponential moving average) of Jabil Inc JBL
| EMA period | EMA current | EMA prev | EMA prev2 | | 5 day EMA | 206.15 | 207.21 | 206.15 | | 12 day EMA | 207.8 | 208.49 | 208.34 | | 20 day EMA | 209.72 | 210.32 | 210.42 | | 35 day EMA | 211.66 | 212.11 | 212.27 | | 50 day EMA | 212.73 | 213.09 | 213.24 |
SMA (simple moving average) of Jabil Inc JBL
| SMA period | SMA current | SMA prev | SMA prev2 | | 5 day SMA | 206.11 | 205.29 | 203.95 | | 12 day SMA | 207.12 | 208 | 208.54 | | 20 day SMA | 213.33 | 213.81 | 214.01 | | 35 day SMA | 211.86 | 211.97 | 211.94 | | 50 day SMA | 212.61 | 212.94 | 213.15 | | 100 day SMA | 208.36 | 207.97 | 207.55 | | 150 day SMA | 186.58 | 186.11 | 185.65 | | 200 day SMA | 179.38 | 179.09 | 178.79 |
|
|
