IllinoisTool ITW full analysis,charts,indicators,moving averages,SMA,DMA,EMA,ADX,MACD,RSIIllinois Tool ITW WideScreen charts, DMA,SMA,EMA technical analysis, forecast prediction, by indicators ADX,MACD,RSI,CCI NYSE stock exchange
operates under Technology sector & deals in Industrial Machinery Components
Daily price and charts and targets IllinoisTool Strong Daily Stock price targets for IllinoisTool ITW are 247.55 and 250.28 | Daily Target 1 | 246.83 | | Daily Target 2 | 248.27 | | Daily Target 3 | 249.56333333333 | | Daily Target 4 | 251 | | Daily Target 5 | 252.29 |
Daily price and volume Illinois Tool
| Date |
Closing |
Open |
Range |
Volume |
Fri 05 December 2025 |
249.70 (0.13%) |
250.12 |
248.13 - 250.86 |
0.8362 times |
Thu 04 December 2025 |
249.38 (-0.26%) |
250.69 |
248.43 - 251.55 |
1.0914 times |
Wed 03 December 2025 |
250.04 (0.67%) |
249.31 |
247.83 - 251.61 |
1.1346 times |
Tue 02 December 2025 |
248.38 (0.36%) |
248.40 |
245.77 - 249.37 |
0.8816 times |
Mon 01 December 2025 |
247.49 (-0.72%) |
247.32 |
247.13 - 250.29 |
1.1397 times |
Fri 28 November 2025 |
249.28 (0.12%) |
248.28 |
248.28 - 250.37 |
0.483 times |
Wed 26 November 2025 |
248.99 (0.26%) |
247.12 |
246.02 - 250.52 |
0.7753 times |
Tue 25 November 2025 |
248.35 (2.37%) |
245.17 |
243.72 - 249.61 |
1.1433 times |
Mon 24 November 2025 |
242.61 (-2.08%) |
248.51 |
242.35 - 248.51 |
0.8604 times |
Fri 21 November 2025 |
247.77 (2.77%) |
242.10 |
241.28 - 248.45 |
1.6546 times |
Thu 20 November 2025 |
241.10 (0.01%) |
243.00 |
239.24 - 244.06 |
1.4992 times |
Weekly price and charts IllinoisTool Strong weekly Stock price targets for IllinoisTool ITW are 247.74 and 253.58 | Weekly Target 1 | 243.19 | | Weekly Target 2 | 246.44 | | Weekly Target 3 | 249.02666666667 | | Weekly Target 4 | 252.28 | | Weekly Target 5 | 254.87 |
Weekly price and volumes for Illinois Tool
| Date |
Closing |
Open |
Range |
Volume |
Fri 05 December 2025 |
249.70 (0.17%) |
247.32 |
245.77 - 251.61 |
0.9123 times |
Fri 28 November 2025 |
249.28 (0.61%) |
248.51 |
242.35 - 250.52 |
0.5854 times |
Fri 21 November 2025 |
247.77 (1.56%) |
243.95 |
238.82 - 248.45 |
1.2076 times |
Fri 14 November 2025 |
243.97 (-0.62%) |
245.19 |
241.72 - 247.85 |
0.8562 times |
Fri 07 November 2025 |
245.49 (0.64%) |
242.61 |
242.02 - 247.09 |
0.9595 times |
Fri 31 October 2025 |
243.92 (0%) |
241.73 |
241.04 - 244.83 |
0.3163 times |
Fri 31 October 2025 |
243.92 (-0.74%) |
248.77 |
240.67 - 249.58 |
1.6033 times |
Fri 24 October 2025 |
245.75 (-1.41%) |
249.17 |
242.80 - 258.43 |
1.6613 times |
Fri 17 October 2025 |
249.26 (1.77%) |
246.54 |
242.53 - 249.75 |
0.8629 times |
Fri 10 October 2025 |
244.93 (-5.8%) |
259.34 |
244.23 - 260.00 |
1.0353 times |
Fri 03 October 2025 |
260.00 (-0.4%) |
262.46 |
258.00 - 263.20 |
0.7618 times |

Monthly price and charts IllinoisTool Strong monthly Stock price targets for IllinoisTool ITW are 247.74 and 253.58 | Monthly Target 1 | 243.19 | | Monthly Target 2 | 246.44 | | Monthly Target 3 | 249.02666666667 | | Monthly Target 4 | 252.28 | | Monthly Target 5 | 254.87 |
Monthly price and volumes Illinois Tool
| Date |
Closing |
Open |
Range |
Volume |
Fri 05 December 2025 |
249.70 (0.17%) |
247.32 |
245.77 - 251.61 |
0.2305 times |
Fri 28 November 2025 |
249.28 (2.2%) |
242.61 |
238.82 - 250.52 |
0.9116 times |
Fri 31 October 2025 |
243.92 (-6.46%) |
259.32 |
240.67 - 262.75 |
1.4828 times |
Tue 30 September 2025 |
260.76 (-1.47%) |
263.27 |
257.16 - 268.68 |
0.8413 times |
Fri 29 August 2025 |
264.65 (3.39%) |
253.48 |
249.67 - 270.74 |
0.9465 times |
Thu 31 July 2025 |
255.97 (3.53%) |
246.07 |
245.18 - 264.61 |
1.1164 times |
Mon 30 June 2025 |
247.25 (0.89%) |
243.96 |
239.56 - 249.92 |
0.7986 times |
Fri 30 May 2025 |
245.08 (2.15%) |
241.01 |
236.68 - 252.75 |
1.125 times |
Wed 30 April 2025 |
239.91 (-3.27%) |
247.26 |
214.66 - 253.23 |
1.3775 times |
Mon 31 March 2025 |
248.01 (-6.05%) |
266.02 |
242.47 - 278.13 |
1.1699 times |
Fri 28 February 2025 |
263.98 (1.86%) |
255.50 |
244.69 - 266.98 |
1.0008 times |

DMA SMA EMA moving averages of Illinois Tool ITW
DMA (daily moving average) of Illinois Tool ITW
| DMA period | DMA value | | 5 day DMA | 249 | | 12 day DMA | 247.01 | | 20 day DMA | 245.87 | | 35 day DMA | 246.68 | | 50 day DMA | 248.9 | | 100 day DMA | 255.14 | | 150 day DMA | 252.77 | | 200 day DMA | 251.27 | EMA (exponential moving average) of Illinois Tool ITW
| EMA period | EMA current | EMA prev | EMA prev2 | | 5 day EMA | 249.09 | 248.79 | 248.5 | | 12 day EMA | 247.72 | 247.36 | 246.99 | | 20 day EMA | 247.26 | 247 | 246.75 | | 35 day EMA | 248.36 | 248.28 | 248.22 | | 50 day EMA | 249.85 | 249.86 | 249.88 |
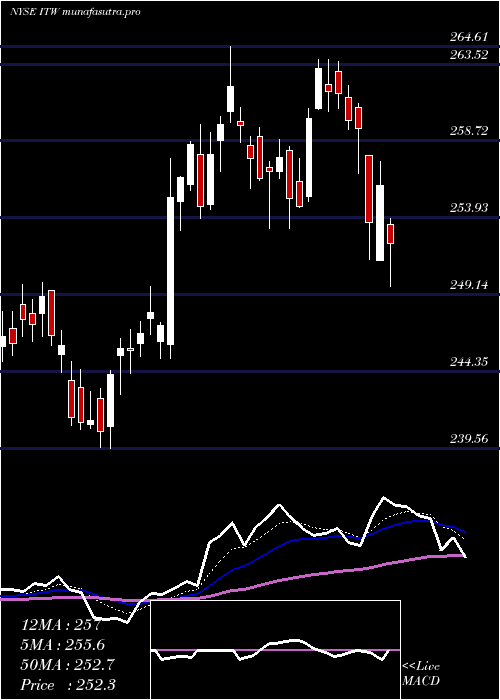
SMA (simple moving average) of Illinois Tool ITW
| SMA period | SMA current | SMA prev | SMA prev2 | | 5 day SMA | 249 | 248.91 | 248.84 | | 12 day SMA | 247.01 | 246.37 | 245.7 | | 20 day SMA | 245.87 | 245.6 | 245.38 | | 35 day SMA | 246.68 | 246.6 | 246.55 | | 50 day SMA | 248.9 | 249.07 | 249.27 | | 100 day SMA | 255.14 | 255.21 | 255.28 | | 150 day SMA | 252.77 | 252.7 | 252.64 | | 200 day SMA | 251.27 | 251.35 | 251.41 |
|
|
