IntegerHoldings ITGR full analysis,charts,indicators,moving averages,SMA,DMA,EMA,ADX,MACD,RSIInteger Holdings ITGR WideScreen charts, DMA,SMA,EMA technical analysis, forecast prediction, by indicators ADX,MACD,RSI,CCI NYSE stock exchange
operates under Miscellaneous sector & deals in Industrial Machinery Components
Daily price and charts and targets IntegerHoldings Strong Daily Stock price targets for IntegerHoldings ITGR are 106.3 and 108.6 | Daily Target 1 | 104.4 | | Daily Target 2 | 105.89 | | Daily Target 3 | 106.70333333333 | | Daily Target 4 | 108.19 | | Daily Target 5 | 109 |
Daily price and volume Integer Holdings
| Date |
Closing |
Open |
Range |
Volume |
Mon 20 October 2025 |
107.37 (2.42%) |
105.22 |
105.22 - 107.52 |
0.9246 times |
Fri 17 October 2025 |
104.83 (1.66%) |
103.05 |
102.20 - 105.13 |
1.2202 times |
Thu 16 October 2025 |
103.12 (-0.66%) |
103.52 |
102.64 - 104.64 |
1.2033 times |
Wed 15 October 2025 |
103.80 (-0.16%) |
103.32 |
102.53 - 105.30 |
1.0304 times |
Tue 14 October 2025 |
103.97 (1.83%) |
101.36 |
100.91 - 104.12 |
1.3595 times |
Mon 13 October 2025 |
102.10 (-1.56%) |
101.18 |
100.27 - 102.92 |
0.973 times |
Tue 07 October 2025 |
103.72 (-1.58%) |
105.46 |
103.71 - 106.58 |
1.017 times |
Mon 06 October 2025 |
105.38 (0.32%) |
105.20 |
103.48 - 105.59 |
0.8118 times |
Fri 03 October 2025 |
105.04 (1.89%) |
103.53 |
102.76 - 105.99 |
1.0873 times |
Thu 02 October 2025 |
103.09 (0.17%) |
103.12 |
102.29 - 103.91 |
0.3729 times |
Wed 01 October 2025 |
102.92 (-0.4%) |
102.89 |
100.86 - 103.41 |
0.8608 times |
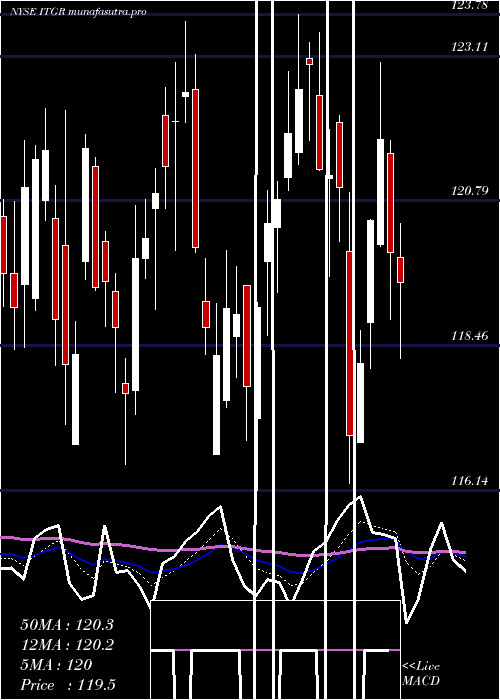
Weekly price and charts IntegerHoldings Strong weekly Stock price targets for IntegerHoldings ITGR are 106.3 and 108.6 | Weekly Target 1 | 104.4 | | Weekly Target 2 | 105.89 | | Weekly Target 3 | 106.70333333333 | | Weekly Target 4 | 108.19 | | Weekly Target 5 | 109 |
Weekly price and volumes for Integer Holdings
| Date |
Closing |
Open |
Range |
Volume |
Mon 20 October 2025 |
107.37 (2.42%) |
105.22 |
105.22 - 107.52 |
0.2157 times |
Fri 17 October 2025 |
104.83 (1.07%) |
101.18 |
100.27 - 105.30 |
1.3496 times |
Tue 07 October 2025 |
103.72 (-1.26%) |
105.20 |
103.48 - 106.58 |
0.4266 times |
Fri 03 October 2025 |
105.04 (3.49%) |
101.33 |
100.16 - 105.99 |
1.0372 times |
Fri 26 September 2025 |
101.50 (-1.75%) |
103.67 |
101.38 - 104.69 |
1.648 times |
Fri 19 September 2025 |
103.31 (1.94%) |
101.37 |
99.73 - 105.57 |
2.3046 times |
Fri 12 September 2025 |
101.34 (-5.24%) |
106.53 |
100.89 - 107.14 |
1.4341 times |
Fri 05 September 2025 |
106.94 (-0.86%) |
107.10 |
105.00 - 108.43 |
0.7745 times |
Fri 29 August 2025 |
107.87 (0%) |
107.29 |
106.72 - 108.11 |
0.1129 times |
Fri 29 August 2025 |
107.87 (-2.45%) |
110.30 |
106.24 - 110.60 |
0.6969 times |
Fri 22 August 2025 |
110.58 (3.55%) |
106.66 |
105.20 - 111.03 |
1.0283 times |
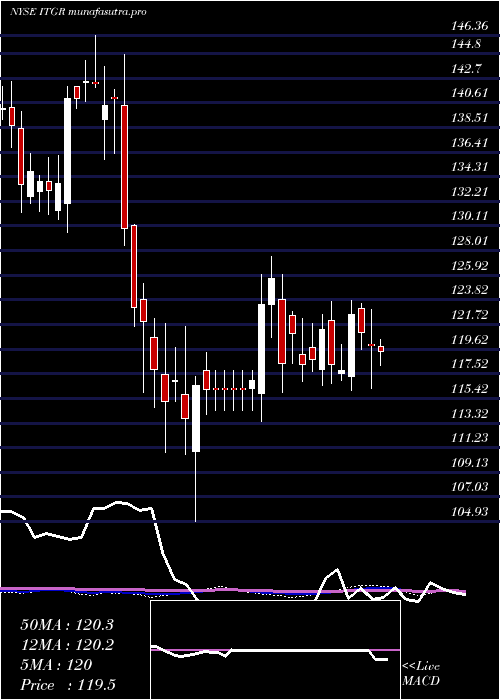
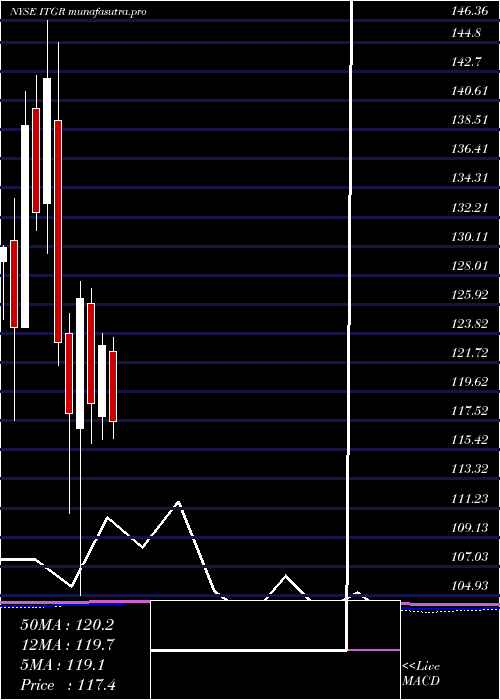
Monthly price and charts IntegerHoldings Strong monthly Stock price targets for IntegerHoldings ITGR are 103.82 and 111.07 | Monthly Target 1 | 97.8 | | Monthly Target 2 | 102.59 | | Monthly Target 3 | 105.05333333333 | | Monthly Target 4 | 109.84 | | Monthly Target 5 | 112.3 |
Monthly price and volumes Integer Holdings
| Date |
Closing |
Open |
Range |
Volume |
Mon 20 October 2025 |
107.37 (3.91%) |
102.89 |
100.27 - 107.52 |
0.4237 times |
Tue 30 September 2025 |
103.33 (-4.21%) |
107.10 |
99.73 - 108.43 |
1.1134 times |
Fri 29 August 2025 |
107.87 (-0.59%) |
107.76 |
105.17 - 111.03 |
0.6515 times |
Thu 31 July 2025 |
108.51 (-11.76%) |
122.48 |
105.57 - 123.49 |
1.2622 times |
Mon 30 June 2025 |
122.97 (3.54%) |
117.85 |
116.14 - 123.78 |
0.9373 times |
Fri 30 May 2025 |
118.76 (-5.98%) |
125.98 |
115.90 - 127.06 |
1.309 times |
Wed 30 April 2025 |
126.31 (7.03%) |
116.97 |
104.93 - 127.56 |
1.6189 times |
Mon 31 March 2025 |
118.01 (-4.21%) |
123.83 |
110.84 - 125.25 |
1.4223 times |
Fri 28 February 2025 |
123.20 (-13.37%) |
139.19 |
121.54 - 144.76 |
0.7672 times |
Fri 31 January 2025 |
142.22 (7.32%) |
133.15 |
129.55 - 146.36 |
0.4945 times |
Tue 31 December 2024 |
132.52 (-4.51%) |
140.05 |
131.26 - 142.41 |
0.3325 times |
DMA SMA EMA moving averages of Integer Holdings ITGR
DMA (daily moving average) of Integer Holdings ITGR
| DMA period | DMA value | | 5 day DMA | 104.62 | | 12 day DMA | 104.06 | | 20 day DMA | 103.51 | | 35 day DMA | 104.15 | | 50 day DMA | 105.11 | | 100 day DMA | 111.1 | | 150 day DMA | 113.56 | | 200 day DMA | 118.73 | EMA (exponential moving average) of Integer Holdings ITGR
| EMA period | EMA current | EMA prev | EMA prev2 | | 5 day EMA | 105.07 | 103.92 | 103.47 | | 12 day EMA | 104.22 | 103.65 | 103.44 | | 20 day EMA | 104.06 | 103.71 | 103.59 | | 35 day EMA | 104.57 | 104.41 | 104.38 | | 50 day EMA | 105.26 | 105.17 | 105.18 |
SMA (simple moving average) of Integer Holdings ITGR
| SMA period | SMA current | SMA prev | SMA prev2 | | 5 day SMA | 104.62 | 103.56 | 103.34 | | 12 day SMA | 104.06 | 103.54 | 103.26 | | 20 day SMA | 103.51 | 103.28 | 103.19 | | 35 day SMA | 104.15 | 104.17 | 104.28 | | 50 day SMA | 105.11 | 105.07 | 105.12 | | 100 day SMA | 111.1 | 111.21 | 111.38 | | 150 day SMA | 113.56 | 113.63 | 113.73 | | 200 day SMA | 118.73 | 118.85 | 119 |
|
|
