GartnerInc IT full analysis,charts,indicators,moving averages,SMA,DMA,EMA,ADX,MACD,RSIGartner Inc IT WideScreen charts, DMA,SMA,EMA technical analysis, forecast prediction, by indicators ADX,MACD,RSI,CCI NYSE stock exchange
operates under Consumer Services sector & deals in Other Consumer Services
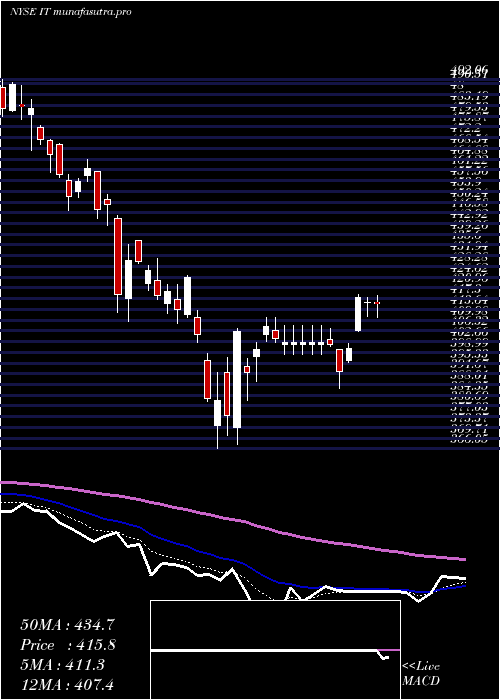
Daily price and charts and targets GartnerInc Strong Daily Stock price targets for GartnerInc IT are 226.47 and 231.79 | Daily Target 1 | 225.37 | | Daily Target 2 | 227.57 | | Daily Target 3 | 230.69 | | Daily Target 4 | 232.89 | | Daily Target 5 | 236.01 |
Daily price and volume Gartner Inc
| Date |
Closing |
Open |
Range |
Volume |
Fri 05 December 2025 |
229.77 (-1%) |
231.40 |
228.49 - 233.81 |
0.8293 times |
Thu 04 December 2025 |
232.10 (0.08%) |
233.87 |
230.39 - 235.74 |
0.8377 times |
Wed 03 December 2025 |
231.91 (1.44%) |
228.66 |
227.66 - 232.43 |
0.9015 times |
Tue 02 December 2025 |
228.62 (-0.94%) |
230.55 |
226.96 - 230.60 |
1.389 times |
Mon 01 December 2025 |
230.78 (-0.84%) |
231.77 |
230.20 - 235.00 |
1.2205 times |
Fri 28 November 2025 |
232.74 (0.64%) |
230.80 |
230.61 - 233.63 |
0.5315 times |
Wed 26 November 2025 |
231.25 (-1.75%) |
234.88 |
230.88 - 236.04 |
0.8053 times |
Tue 25 November 2025 |
235.38 (2.27%) |
229.48 |
229.48 - 236.11 |
0.9401 times |
Mon 24 November 2025 |
230.16 (-1.72%) |
234.38 |
227.03 - 235.70 |
0.6891 times |
Fri 21 November 2025 |
234.18 (4.48%) |
223.55 |
223.07 - 240.25 |
1.8562 times |
Thu 20 November 2025 |
224.13 (-0.78%) |
227.14 |
222.60 - 228.45 |
1.118 times |
Weekly price and charts GartnerInc Strong weekly Stock price targets for GartnerInc IT are 223.98 and 232.76 | Weekly Target 1 | 222.04 | | Weekly Target 2 | 225.91 | | Weekly Target 3 | 230.82333333333 | | Weekly Target 4 | 234.69 | | Weekly Target 5 | 239.6 |
Weekly price and volumes for Gartner Inc
| Date |
Closing |
Open |
Range |
Volume |
Fri 05 December 2025 |
229.77 (-1.28%) |
231.77 |
226.96 - 235.74 |
1.0732 times |
Fri 28 November 2025 |
232.74 (-0.61%) |
234.38 |
227.03 - 236.11 |
0.6147 times |
Fri 21 November 2025 |
234.18 (1.36%) |
230.05 |
222.60 - 240.25 |
1.2946 times |
Fri 14 November 2025 |
231.03 (0.2%) |
230.91 |
225.29 - 234.10 |
1.1135 times |
Fri 07 November 2025 |
230.57 (-7.16%) |
252.37 |
222.54 - 253.54 |
1.3196 times |
Fri 31 October 2025 |
248.34 (0%) |
247.02 |
244.50 - 249.38 |
0.2278 times |
Fri 31 October 2025 |
248.34 (-0.75%) |
252.29 |
244.50 - 257.69 |
1.1655 times |
Fri 24 October 2025 |
250.21 (6.14%) |
237.99 |
236.15 - 261.10 |
1.212 times |
Fri 17 October 2025 |
235.73 (-3.89%) |
242.25 |
234.00 - 249.45 |
1.4367 times |
Tue 07 October 2025 |
245.27 (-4.64%) |
259.00 |
245.01 - 260.67 |
0.5424 times |
Fri 03 October 2025 |
257.20 (-2.61%) |
265.62 |
242.26 - 265.62 |
2.1035 times |
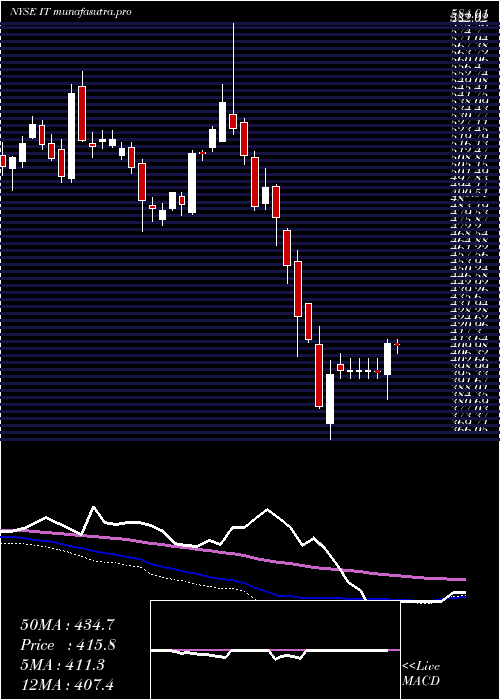
Monthly price and charts GartnerInc Strong monthly Stock price targets for GartnerInc IT are 223.98 and 232.76 | Monthly Target 1 | 222.04 | | Monthly Target 2 | 225.91 | | Monthly Target 3 | 230.82333333333 | | Monthly Target 4 | 234.69 | | Monthly Target 5 | 239.6 |
Monthly price and volumes Gartner Inc
| Date |
Closing |
Open |
Range |
Volume |
Fri 05 December 2025 |
229.77 (-1.28%) |
231.77 |
226.96 - 235.74 |
0.2114 times |
Fri 28 November 2025 |
232.74 (-6.28%) |
252.37 |
222.54 - 253.54 |
0.8554 times |
Fri 31 October 2025 |
248.34 (-5.53%) |
261.90 |
234.00 - 264.91 |
1.1354 times |
Tue 30 September 2025 |
262.87 (4.65%) |
248.26 |
231.33 - 265.85 |
1.8449 times |
Fri 29 August 2025 |
251.19 (-25.83%) |
334.66 |
223.65 - 335.84 |
1.9342 times |
Thu 31 July 2025 |
338.65 (-16.22%) |
403.54 |
337.40 - 409.76 |
0.9887 times |
Mon 30 June 2025 |
404.22 (-7.38%) |
432.27 |
390.16 - 434.12 |
0.8771 times |
Fri 30 May 2025 |
436.42 (3.64%) |
421.63 |
409.98 - 451.73 |
0.6324 times |
Wed 30 April 2025 |
421.08 (0.32%) |
416.85 |
366.05 - 425.14 |
0.7566 times |
Mon 31 March 2025 |
419.74 (-15.77%) |
498.50 |
409.50 - 499.72 |
0.7638 times |
Fri 28 February 2025 |
498.32 (-8.2%) |
536.56 |
485.86 - 584.01 |
0.5017 times |

DMA SMA EMA moving averages of Gartner Inc IT
DMA (daily moving average) of Gartner Inc IT
| DMA period | DMA value | | 5 day DMA | 230.64 | | 12 day DMA | 230.58 | | 20 day DMA | 230.11 | | 35 day DMA | 236.62 | | 50 day DMA | 241.7 | | 100 day DMA | 259.37 | | 150 day DMA | 313.2 | | 200 day DMA | 344.89 | EMA (exponential moving average) of Gartner Inc IT
| EMA period | EMA current | EMA prev | EMA prev2 | | 5 day EMA | 230.82 | 231.35 | 230.98 | | 12 day EMA | 231.08 | 231.32 | 231.18 | | 20 day EMA | 232.53 | 232.82 | 232.9 | | 35 day EMA | 236.67 | 237.08 | 237.37 | | 50 day EMA | 241.68 | 242.17 | 242.58 |
SMA (simple moving average) of Gartner Inc IT
| SMA period | SMA current | SMA prev | SMA prev2 | | 5 day SMA | 230.64 | 231.23 | 231.06 | | 12 day SMA | 230.58 | 230.29 | 229.85 | | 20 day SMA | 230.11 | 229.94 | 230.19 | | 35 day SMA | 236.62 | 236.8 | 236.93 | | 50 day SMA | 241.7 | 242.31 | 242.8 | | 100 day SMA | 259.37 | 260.81 | 262.37 | | 150 day SMA | 313.2 | 314.44 | 315.66 | | 200 day SMA | 344.89 | 346.32 | 347.74 |
|
|
