IndependenceRealty IRT full analysis,charts,indicators,moving averages,SMA,DMA,EMA,ADX,MACD,RSIIndependence Realty IRT WideScreen charts, DMA,SMA,EMA technical analysis, forecast prediction, by indicators ADX,MACD,RSI,CCI NYSE stock exchange
operates under Consumer Services sector & deals in Real Estate Investment Trusts
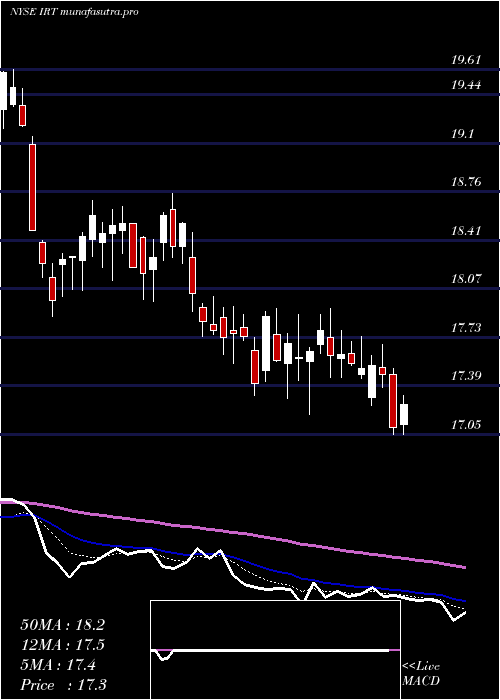
Daily price and charts and targets IndependenceRealty Strong Daily Stock price targets for IndependenceRealty IRT are 16.22 and 16.55 | Daily Target 1 | 15.97 | | Daily Target 2 | 16.14 | | Daily Target 3 | 16.296666666667 | | Daily Target 4 | 16.47 | | Daily Target 5 | 16.63 |
Daily price and volume Independence Realty
| Date |
Closing |
Open |
Range |
Volume |
Wed 22 October 2025 |
16.32 (0.74%) |
16.25 |
16.12 - 16.45 |
1.0401 times |
Tue 21 October 2025 |
16.20 (0.75%) |
16.13 |
16.05 - 16.37 |
0.7645 times |
Mon 20 October 2025 |
16.08 (0.31%) |
16.06 |
16.03 - 16.19 |
0.5961 times |
Fri 17 October 2025 |
16.03 (-0.25%) |
16.04 |
15.91 - 16.21 |
0.9256 times |
Thu 16 October 2025 |
16.07 (-0.19%) |
16.11 |
15.91 - 16.17 |
0.7814 times |
Wed 15 October 2025 |
16.10 (-0.92%) |
16.31 |
16.06 - 16.44 |
0.9431 times |
Tue 14 October 2025 |
16.25 (-0.67%) |
16.30 |
16.09 - 16.38 |
1.4107 times |
Mon 13 October 2025 |
16.36 (0.8%) |
16.22 |
16.17 - 16.39 |
1.0953 times |
Tue 07 October 2025 |
16.23 (0.74%) |
16.15 |
16.14 - 16.42 |
1.5485 times |
Mon 06 October 2025 |
16.11 (-1.23%) |
16.11 |
16.11 - 16.36 |
0.8947 times |
Fri 03 October 2025 |
16.31 (-0.06%) |
16.34 |
16.29 - 16.52 |
1.0993 times |
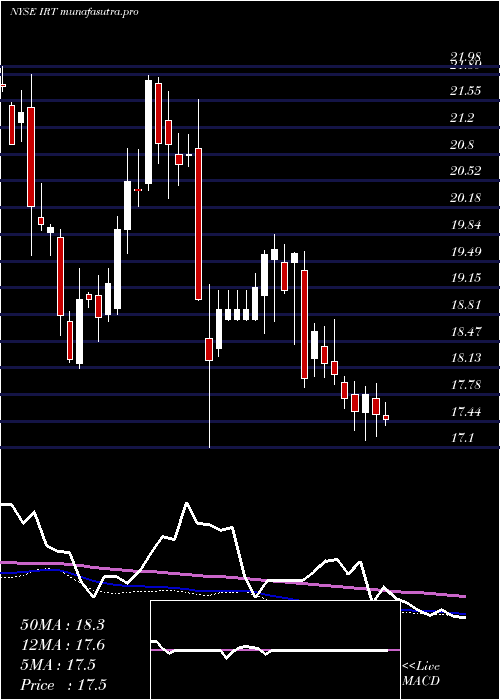
Weekly price and charts IndependenceRealty Strong weekly Stock price targets for IndependenceRealty IRT are 16.18 and 16.6 | Weekly Target 1 | 15.85 | | Weekly Target 2 | 16.08 | | Weekly Target 3 | 16.266666666667 | | Weekly Target 4 | 16.5 | | Weekly Target 5 | 16.69 |
Weekly price and volumes for Independence Realty
| Date |
Closing |
Open |
Range |
Volume |
Wed 22 October 2025 |
16.32 (1.81%) |
16.06 |
16.03 - 16.45 |
0.5594 times |
Fri 17 October 2025 |
16.03 (-1.23%) |
16.22 |
15.91 - 16.44 |
1.2015 times |
Tue 07 October 2025 |
16.23 (-0.49%) |
16.11 |
16.11 - 16.42 |
0.5693 times |
Fri 03 October 2025 |
16.31 (-1.39%) |
16.52 |
16.12 - 16.97 |
1.3359 times |
Fri 26 September 2025 |
16.54 (-3.73%) |
17.19 |
16.43 - 17.19 |
1.3425 times |
Fri 19 September 2025 |
17.18 (-1.26%) |
17.37 |
16.87 - 17.44 |
1.3864 times |
Fri 12 September 2025 |
17.40 (-3.55%) |
17.86 |
17.30 - 17.99 |
1.3911 times |
Fri 05 September 2025 |
18.04 (-0.39%) |
17.88 |
17.44 - 18.18 |
0.9984 times |
Fri 29 August 2025 |
18.11 (0%) |
17.86 |
17.83 - 18.12 |
0.2161 times |
Fri 29 August 2025 |
18.11 (2.43%) |
17.61 |
17.35 - 18.12 |
0.9993 times |
Fri 22 August 2025 |
17.68 (1.43%) |
17.43 |
17.09 - 17.82 |
1.2434 times |
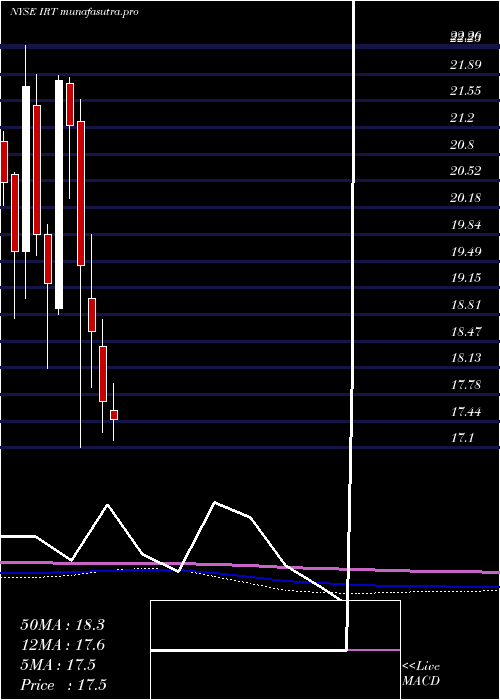
Monthly price and charts IndependenceRealty Strong monthly Stock price targets for IndependenceRealty IRT are 15.59 and 16.65 | Monthly Target 1 | 15.34 | | Monthly Target 2 | 15.83 | | Monthly Target 3 | 16.4 | | Monthly Target 4 | 16.89 | | Monthly Target 5 | 17.46 |
Monthly price and volumes Independence Realty
| Date |
Closing |
Open |
Range |
Volume |
Wed 22 October 2025 |
16.32 (-0.43%) |
16.42 |
15.91 - 16.97 |
0.6843 times |
Tue 30 September 2025 |
16.39 (-9.5%) |
17.88 |
16.13 - 18.18 |
1.2276 times |
Fri 29 August 2025 |
18.11 (7.99%) |
17.18 |
16.59 - 18.12 |
1.216 times |
Thu 31 July 2025 |
16.77 (-5.2%) |
17.58 |
16.64 - 17.93 |
1.3728 times |
Mon 30 June 2025 |
17.69 (-4.84%) |
18.40 |
17.30 - 18.74 |
1.1142 times |
Fri 30 May 2025 |
18.59 (-4.32%) |
19.01 |
17.88 - 19.83 |
0.799 times |
Wed 30 April 2025 |
19.43 (-8.48%) |
21.28 |
17.10 - 21.56 |
0.9585 times |
Mon 31 March 2025 |
21.23 (-2.61%) |
21.77 |
20.29 - 21.85 |
0.9225 times |
Fri 28 February 2025 |
21.80 (13.48%) |
18.89 |
18.81 - 21.87 |
0.9387 times |
Fri 31 January 2025 |
19.21 (-3.18%) |
19.84 |
18.12 - 19.96 |
0.7663 times |
Tue 31 December 2024 |
19.84 (-8.7%) |
21.48 |
19.56 - 21.89 |
0.6315 times |
DMA SMA EMA moving averages of Independence Realty IRT
DMA (daily moving average) of Independence Realty IRT
| DMA period | DMA value | | 5 day DMA | 16.14 | | 12 day DMA | 16.2 | | 20 day DMA | 16.37 | | 35 day DMA | 16.86 | | 50 day DMA | 17.04 | | 100 day DMA | 17.37 | | 150 day DMA | 18.07 | | 200 day DMA | 18.53 | EMA (exponential moving average) of Independence Realty IRT
| EMA period | EMA current | EMA prev | EMA prev2 | | 5 day EMA | 16.2 | 16.14 | 16.11 | | 12 day EMA | 16.26 | 16.25 | 16.26 | | 20 day EMA | 16.42 | 16.43 | 16.45 | | 35 day EMA | 16.68 | 16.7 | 16.73 | | 50 day EMA | 16.96 | 16.99 | 17.02 |
SMA (simple moving average) of Independence Realty IRT
| SMA period | SMA current | SMA prev | SMA prev2 | | 5 day SMA | 16.14 | 16.1 | 16.11 | | 12 day SMA | 16.2 | 16.2 | 16.22 | | 20 day SMA | 16.37 | 16.41 | 16.45 | | 35 day SMA | 16.86 | 16.91 | 16.96 | | 50 day SMA | 17.04 | 17.06 | 17.09 | | 100 day SMA | 17.37 | 17.39 | 17.41 | | 150 day SMA | 18.07 | 18.1 | 18.13 | | 200 day SMA | 18.53 | 18.55 | 18.57 |
|
|
