IngersollRand IR full analysis,charts,indicators,moving averages,SMA,DMA,EMA,ADX,MACD,RSIIngersoll Rand IR WideScreen charts, DMA,SMA,EMA technical analysis, forecast prediction, by indicators ADX,MACD,RSI,CCI NYSE stock exchange
operates under Capital Goods sector & deals in Auto Parts O E M
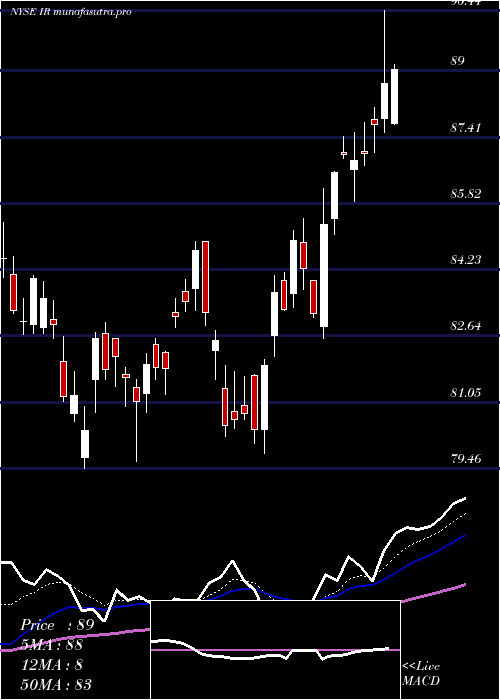
Daily price and charts and targets IngersollRand Strong Daily Stock price targets for IngersollRand IR are 79.72 and 80.53 | Daily Target 1 | 79.08 | | Daily Target 2 | 79.54 | | Daily Target 3 | 79.893333333333 | | Daily Target 4 | 80.35 | | Daily Target 5 | 80.7 |
Daily price and volume Ingersoll Rand
| Date |
Closing |
Open |
Range |
Volume |
Thu 04 December 2025 |
79.99 (0.3%) |
79.81 |
79.44 - 80.25 |
0.7743 times |
Wed 03 December 2025 |
79.75 (0.72%) |
79.48 |
79.01 - 80.16 |
0.557 times |
Tue 02 December 2025 |
79.18 (-0.01%) |
79.29 |
78.17 - 79.74 |
0.7681 times |
Mon 01 December 2025 |
79.19 (-1.43%) |
79.68 |
79.13 - 80.87 |
0.7836 times |
Fri 28 November 2025 |
80.34 (0.59%) |
79.80 |
79.75 - 80.72 |
0.3813 times |
Wed 26 November 2025 |
79.87 (0.52%) |
79.25 |
79.09 - 80.43 |
0.8144 times |
Tue 25 November 2025 |
79.46 (2.21%) |
78.45 |
77.80 - 79.87 |
0.8289 times |
Mon 24 November 2025 |
77.74 (-1.02%) |
78.59 |
76.79 - 78.76 |
2.1278 times |
Fri 21 November 2025 |
78.54 (5.37%) |
74.38 |
74.38 - 79.40 |
1.4223 times |
Thu 20 November 2025 |
74.54 (1.13%) |
73.31 |
73.31 - 75.55 |
1.5423 times |
Wed 19 November 2025 |
73.71 (0.2%) |
73.73 |
72.89 - 73.93 |
1.636 times |
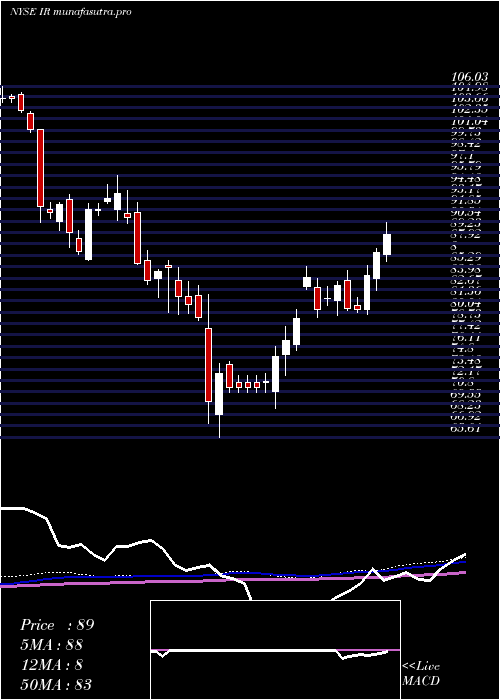
Weekly price and charts IngersollRand Strong weekly Stock price targets for IngersollRand IR are 79.08 and 81.78 | Weekly Target 1 | 76.98 | | Weekly Target 2 | 78.48 | | Weekly Target 3 | 79.676666666667 | | Weekly Target 4 | 81.18 | | Weekly Target 5 | 82.38 |
Weekly price and volumes for Ingersoll Rand
| Date |
Closing |
Open |
Range |
Volume |
Thu 04 December 2025 |
79.99 (-0.44%) |
79.68 |
78.17 - 80.87 |
0.6239 times |
Fri 28 November 2025 |
80.34 (2.29%) |
78.59 |
76.79 - 80.72 |
0.8987 times |
Fri 21 November 2025 |
78.54 (4.07%) |
75.00 |
72.45 - 79.40 |
1.3804 times |
Fri 14 November 2025 |
75.47 (-2.62%) |
77.94 |
74.64 - 78.92 |
1.0251 times |
Fri 07 November 2025 |
77.50 (1.53%) |
75.42 |
75.29 - 79.84 |
1.0972 times |
Fri 31 October 2025 |
76.33 (0%) |
76.43 |
75.00 - 79.21 |
0.549 times |
Fri 31 October 2025 |
76.33 (-4.32%) |
80.99 |
75.00 - 81.41 |
1.9137 times |
Fri 24 October 2025 |
79.78 (3.32%) |
77.97 |
77.76 - 81.19 |
0.8152 times |
Fri 17 October 2025 |
77.22 (-5.08%) |
76.89 |
74.42 - 78.26 |
1.1818 times |
Tue 07 October 2025 |
81.35 (-3.1%) |
84.00 |
80.96 - 84.62 |
0.5149 times |
Fri 03 October 2025 |
83.95 (2%) |
82.92 |
81.37 - 84.60 |
1.188 times |
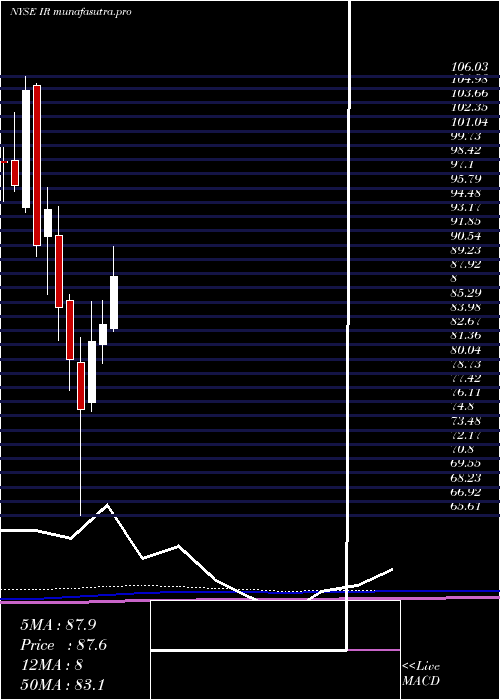
Monthly price and charts IngersollRand Strong monthly Stock price targets for IngersollRand IR are 79.08 and 81.78 | Monthly Target 1 | 76.98 | | Monthly Target 2 | 78.48 | | Monthly Target 3 | 79.676666666667 | | Monthly Target 4 | 81.18 | | Monthly Target 5 | 82.38 |
Monthly price and volumes Ingersoll Rand
| Date |
Closing |
Open |
Range |
Volume |
Thu 04 December 2025 |
79.99 (-0.44%) |
79.68 |
78.17 - 80.87 |
0.1343 times |
Fri 28 November 2025 |
80.34 (5.25%) |
75.42 |
72.45 - 80.72 |
0.9472 times |
Fri 31 October 2025 |
76.33 (-7.61%) |
81.86 |
74.42 - 84.62 |
1.2133 times |
Tue 30 September 2025 |
82.62 (4.02%) |
78.60 |
76.87 - 83.03 |
1.4092 times |
Fri 29 August 2025 |
79.43 (-6.14%) |
79.20 |
73.87 - 81.49 |
1.08 times |
Thu 31 July 2025 |
84.63 (1.74%) |
82.86 |
82.58 - 90.44 |
1.03 times |
Mon 30 June 2025 |
83.18 (1.89%) |
81.41 |
79.63 - 85.45 |
0.6988 times |
Fri 30 May 2025 |
81.64 (8.23%) |
76.05 |
75.20 - 85.37 |
1.2779 times |
Wed 30 April 2025 |
75.43 (-5.75%) |
79.71 |
65.61 - 82.07 |
1.3377 times |
Mon 31 March 2025 |
80.03 (-5.6%) |
85.46 |
77.18 - 85.97 |
0.8718 times |
Fri 28 February 2025 |
84.78 (-9.62%) |
91.40 |
81.71 - 94.10 |
0.8735 times |
DMA SMA EMA moving averages of Ingersoll Rand IR
DMA (daily moving average) of Ingersoll Rand IR
| DMA period | DMA value | | 5 day DMA | 79.69 | | 12 day DMA | 77.99 | | 20 day DMA | 77.43 | | 35 day DMA | 77.82 | | 50 day DMA | 78.84 | | 100 day DMA | 80.08 | | 150 day DMA | 80.72 | | 200 day DMA | 80.2 | EMA (exponential moving average) of Ingersoll Rand IR
| EMA period | EMA current | EMA prev | EMA prev2 | | 5 day EMA | 79.54 | 79.31 | 79.09 | | 12 day EMA | 78.64 | 78.4 | 78.16 | | 20 day EMA | 78.27 | 78.09 | 77.91 | | 35 day EMA | 78.46 | 78.37 | 78.29 | | 50 day EMA | 79 | 78.96 | 78.93 |
SMA (simple moving average) of Ingersoll Rand IR
| SMA period | SMA current | SMA prev | SMA prev2 | | 5 day SMA | 79.69 | 79.67 | 79.61 | | 12 day SMA | 77.99 | 77.46 | 77.11 | | 20 day SMA | 77.43 | 77.35 | 77.23 | | 35 day SMA | 77.82 | 77.73 | 77.66 | | 50 day SMA | 78.84 | 78.88 | 78.91 | | 100 day SMA | 80.08 | 80.16 | 80.24 | | 150 day SMA | 80.72 | 80.68 | 80.66 | | 200 day SMA | 80.2 | 80.26 | 80.32 |
|
|
