IqviaHoldings IQV full analysis,charts,indicators,moving averages,SMA,DMA,EMA,ADX,MACD,RSIIqvia Holdings IQV WideScreen charts, DMA,SMA,EMA technical analysis, forecast prediction, by indicators ADX,MACD,RSI,CCI NYSE stock exchange
operates under Health Care sector & deals in Biotechnology Commercial Physical Biological Resarch
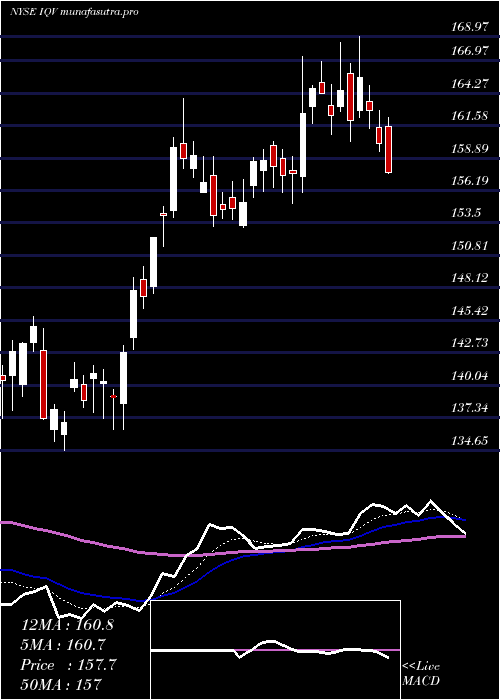
Daily price and charts and targets IqviaHoldings Strong Daily Stock price targets for IqviaHoldings IQV are 212.71 and 226.23 | Daily Target 1 | 208.63 | | Daily Target 2 | 216.78 | | Daily Target 3 | 222.15333333333 | | Daily Target 4 | 230.3 | | Daily Target 5 | 235.67 |
Daily price and volume Iqvia Holdings
| Date |
Closing |
Open |
Range |
Volume |
Thu 04 December 2025 |
224.92 (-1.02%) |
227.53 |
214.01 - 227.53 |
2.2555 times |
Wed 03 December 2025 |
227.24 (0.71%) |
226.74 |
226.02 - 230.80 |
0.8376 times |
Tue 02 December 2025 |
225.63 (-1.24%) |
228.16 |
225.54 - 229.83 |
1.0707 times |
Mon 01 December 2025 |
228.47 (-0.67%) |
229.16 |
228.27 - 232.58 |
0.8662 times |
Fri 28 November 2025 |
230.01 (-0.77%) |
232.52 |
229.98 - 232.71 |
0.3223 times |
Wed 26 November 2025 |
231.80 (-0.05%) |
230.44 |
228.69 - 232.21 |
0.865 times |
Tue 25 November 2025 |
231.92 (1.64%) |
230.00 |
228.82 - 234.29 |
0.9839 times |
Mon 24 November 2025 |
228.18 (1.46%) |
224.63 |
222.00 - 228.77 |
1.1392 times |
Fri 21 November 2025 |
224.90 (3.59%) |
217.39 |
216.55 - 225.90 |
0.9891 times |
Thu 20 November 2025 |
217.11 (-0.17%) |
219.27 |
216.05 - 222.00 |
0.6705 times |
Wed 19 November 2025 |
217.48 (0.09%) |
214.96 |
214.96 - 218.99 |
0.5923 times |
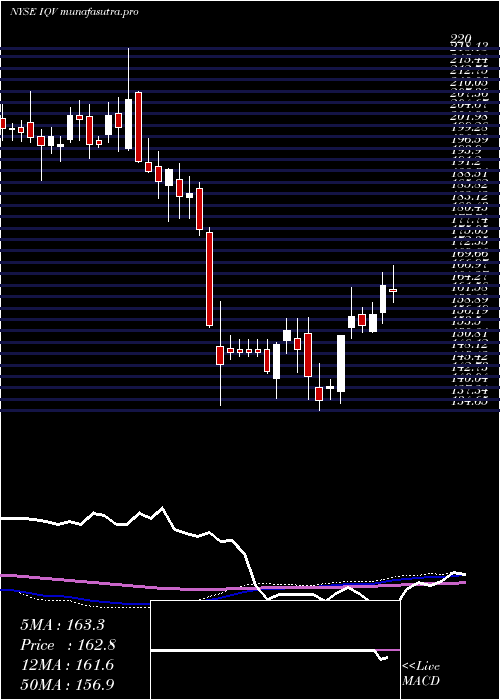
Weekly price and charts IqviaHoldings Strong weekly Stock price targets for IqviaHoldings IQV are 210.18 and 228.75 | Weekly Target 1 | 205.27 | | Weekly Target 2 | 215.09 | | Weekly Target 3 | 223.83666666667 | | Weekly Target 4 | 233.66 | | Weekly Target 5 | 242.41 |
Weekly price and volumes for Iqvia Holdings
| Date |
Closing |
Open |
Range |
Volume |
Thu 04 December 2025 |
224.92 (-2.21%) |
229.16 |
214.01 - 232.58 |
1.1641 times |
Fri 28 November 2025 |
230.01 (2.27%) |
224.63 |
222.00 - 234.29 |
0.7661 times |
Fri 21 November 2025 |
224.90 (1.94%) |
219.39 |
213.90 - 225.90 |
0.9483 times |
Fri 14 November 2025 |
220.61 (4.82%) |
213.20 |
210.30 - 228.12 |
1.228 times |
Fri 07 November 2025 |
210.46 (-2.77%) |
210.86 |
206.72 - 215.94 |
0.9668 times |
Fri 31 October 2025 |
216.46 (0%) |
216.27 |
214.09 - 218.51 |
0.2423 times |
Fri 31 October 2025 |
216.46 (-1.84%) |
221.77 |
209.46 - 222.59 |
1.7054 times |
Fri 24 October 2025 |
220.52 (7.81%) |
206.32 |
205.01 - 225.00 |
1.4809 times |
Fri 17 October 2025 |
204.55 (1.84%) |
198.64 |
198.64 - 208.18 |
1.2275 times |
Tue 07 October 2025 |
200.86 (-2.79%) |
208.00 |
200.23 - 208.00 |
0.2707 times |
Fri 03 October 2025 |
206.63 (15.08%) |
180.94 |
177.08 - 209.48 |
1.2789 times |
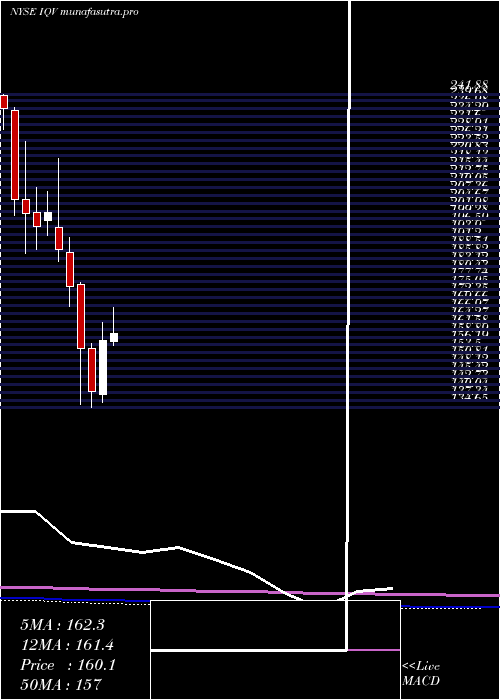
Monthly price and charts IqviaHoldings Strong monthly Stock price targets for IqviaHoldings IQV are 210.18 and 228.75 | Monthly Target 1 | 205.27 | | Monthly Target 2 | 215.09 | | Monthly Target 3 | 223.83666666667 | | Monthly Target 4 | 233.66 | | Monthly Target 5 | 242.41 |
Monthly price and volumes Iqvia Holdings
| Date |
Closing |
Open |
Range |
Volume |
Thu 04 December 2025 |
224.92 (-2.21%) |
229.16 |
214.01 - 232.58 |
0.2101 times |
Fri 28 November 2025 |
230.01 (6.26%) |
210.86 |
206.72 - 234.29 |
0.7054 times |
Fri 31 October 2025 |
216.46 (13.96%) |
190.26 |
190.26 - 225.00 |
1.0495 times |
Tue 30 September 2025 |
189.94 (-0.46%) |
189.28 |
176.16 - 191.86 |
0.7034 times |
Fri 29 August 2025 |
190.81 (2.66%) |
183.27 |
176.47 - 196.22 |
0.7662 times |
Thu 31 July 2025 |
185.86 (17.94%) |
157.31 |
156.01 - 206.78 |
1.4228 times |
Mon 30 June 2025 |
157.59 (12.3%) |
139.14 |
136.41 - 163.79 |
1.3631 times |
Fri 30 May 2025 |
140.33 (-9.51%) |
154.86 |
134.65 - 156.53 |
1.6194 times |
Wed 30 April 2025 |
155.07 (-12.04%) |
176.92 |
135.97 - 177.65 |
1.312 times |
Mon 31 March 2025 |
176.30 (-6.62%) |
187.72 |
169.37 - 193.01 |
0.8482 times |
Fri 28 February 2025 |
188.80 (-6.24%) |
196.50 |
184.66 - 220.00 |
0.8167 times |
DMA SMA EMA moving averages of Iqvia Holdings IQV
DMA (daily moving average) of Iqvia Holdings IQV
| DMA period | DMA value | | 5 day DMA | 227.25 | | 12 day DMA | 225.41 | | 20 day DMA | 221.95 | | 35 day DMA | 218.92 | | 50 day DMA | 211.54 | | 100 day DMA | 197.94 | | 150 day DMA | 182.52 | | 200 day DMA | 179.94 | EMA (exponential moving average) of Iqvia Holdings IQV
| EMA period | EMA current | EMA prev | EMA prev2 | | 5 day EMA | 226.61 | 227.45 | 227.56 | | 12 day EMA | 225.27 | 225.33 | 224.98 | | 20 day EMA | 222.6 | 222.36 | 221.85 | | 35 day EMA | 216.75 | 216.27 | 215.62 | | 50 day EMA | 211.1 | 210.54 | 209.86 |
SMA (simple moving average) of Iqvia Holdings IQV
| SMA period | SMA current | SMA prev | SMA prev2 | | 5 day SMA | 227.25 | 228.63 | 229.57 | | 12 day SMA | 225.41 | 224.68 | 224.13 | | 20 day SMA | 221.95 | 221.21 | 220.4 | | 35 day SMA | 218.92 | 218.3 | 217.65 | | 50 day SMA | 211.54 | 210.78 | 210.04 | | 100 day SMA | 197.94 | 197.35 | 196.7 | | 150 day SMA | 182.52 | 182.02 | 181.51 | | 200 day SMA | 179.94 | 179.79 | 179.65 |
|
|
