InvitationHomes INVH full analysis,charts,indicators,moving averages,SMA,DMA,EMA,ADX,MACD,RSIInvitation Homes INVH WideScreen charts, DMA,SMA,EMA technical analysis, forecast prediction, by indicators ADX,MACD,RSI,CCI NYSE stock exchange
operates under Finance sector & deals in Real Estate
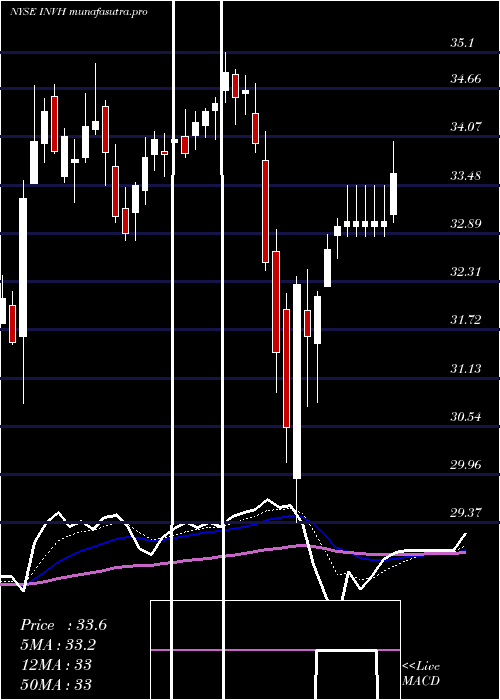
Daily price and charts and targets InvitationHomes Strong Daily Stock price targets for InvitationHomes INVH are 28.6 and 29.09 | Daily Target 1 | 28.24 | | Daily Target 2 | 28.46 | | Daily Target 3 | 28.726666666667 | | Daily Target 4 | 28.95 | | Daily Target 5 | 29.22 |
Daily price and volume Invitation Homes
| Date |
Closing |
Open |
Range |
Volume |
Tue 21 October 2025 |
28.69 (0.31%) |
28.60 |
28.50 - 28.99 |
0.8541 times |
Mon 20 October 2025 |
28.60 (0.28%) |
28.58 |
28.39 - 28.86 |
0.86 times |
Fri 17 October 2025 |
28.52 (0.25%) |
28.57 |
28.30 - 28.61 |
1.0534 times |
Thu 16 October 2025 |
28.45 (0.11%) |
28.48 |
28.22 - 28.64 |
0.9266 times |
Wed 15 October 2025 |
28.42 (-0.32%) |
28.56 |
28.24 - 28.76 |
0.989 times |
Tue 14 October 2025 |
28.51 (0.92%) |
28.27 |
28.27 - 28.64 |
1.4249 times |
Mon 13 October 2025 |
28.25 (0.39%) |
27.90 |
27.82 - 28.32 |
1.0772 times |
Tue 07 October 2025 |
28.14 (-0.28%) |
28.32 |
28.03 - 28.49 |
0.9651 times |
Mon 06 October 2025 |
28.22 (-1.47%) |
28.69 |
28.17 - 28.75 |
1.0704 times |
Fri 03 October 2025 |
28.64 (-0.21%) |
28.71 |
28.62 - 28.94 |
0.7793 times |
Thu 02 October 2025 |
28.70 (-1.07%) |
29.01 |
28.57 - 29.02 |
0.6267 times |
Weekly price and charts InvitationHomes Strong weekly Stock price targets for InvitationHomes INVH are 28.54 and 29.14 | Weekly Target 1 | 28.09 | | Weekly Target 2 | 28.39 | | Weekly Target 3 | 28.69 | | Weekly Target 4 | 28.99 | | Weekly Target 5 | 29.29 |
Weekly price and volumes for Invitation Homes
| Date |
Closing |
Open |
Range |
Volume |
Tue 21 October 2025 |
28.69 (0.6%) |
28.58 |
28.39 - 28.99 |
0.4772 times |
Fri 17 October 2025 |
28.52 (1.35%) |
27.90 |
27.82 - 28.76 |
1.5232 times |
Tue 07 October 2025 |
28.14 (-1.75%) |
28.69 |
28.03 - 28.75 |
0.5667 times |
Fri 03 October 2025 |
28.64 (-1.85%) |
29.22 |
28.57 - 29.45 |
1.0843 times |
Fri 26 September 2025 |
29.18 (-1.55%) |
29.65 |
28.76 - 29.81 |
1.3795 times |
Fri 19 September 2025 |
29.64 (-1.89%) |
30.16 |
29.28 - 30.30 |
1.7778 times |
Fri 12 September 2025 |
30.21 (-0.13%) |
30.00 |
29.88 - 30.65 |
1.0534 times |
Fri 05 September 2025 |
30.25 (-3.32%) |
31.03 |
29.99 - 31.16 |
1.0187 times |
Fri 29 August 2025 |
31.29 (0%) |
30.94 |
30.83 - 31.33 |
0.2167 times |
Fri 29 August 2025 |
31.29 (0.1%) |
31.26 |
30.48 - 31.38 |
0.9024 times |
Fri 22 August 2025 |
31.26 (2.36%) |
30.49 |
29.95 - 31.32 |
1.0422 times |
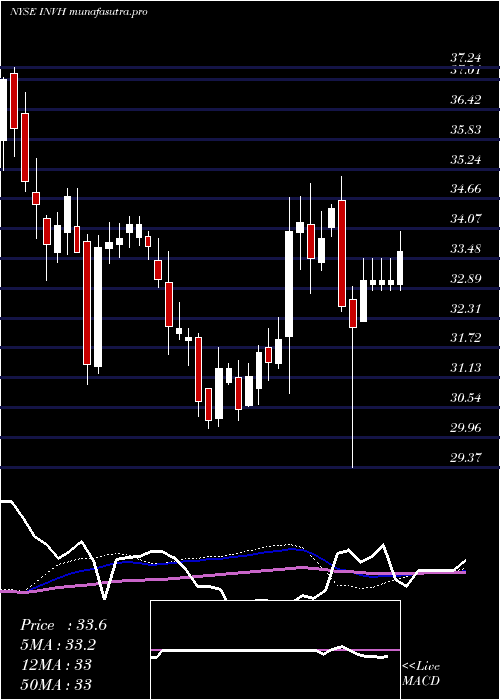
Monthly price and charts InvitationHomes Strong monthly Stock price targets for InvitationHomes INVH are 27.44 and 29.07 | Monthly Target 1 | 27.02 | | Monthly Target 2 | 27.86 | | Monthly Target 3 | 28.653333333333 | | Monthly Target 4 | 29.49 | | Monthly Target 5 | 30.28 |
Monthly price and volumes Invitation Homes
| Date |
Closing |
Open |
Range |
Volume |
Tue 21 October 2025 |
28.69 (-2.18%) |
29.30 |
27.82 - 29.45 |
0.7831 times |
Tue 30 September 2025 |
29.33 (-6.26%) |
31.03 |
28.76 - 31.16 |
1.4048 times |
Fri 29 August 2025 |
31.29 (2.09%) |
31.08 |
29.72 - 31.38 |
1.0932 times |
Thu 31 July 2025 |
30.65 (-6.55%) |
32.85 |
29.86 - 33.21 |
1.0727 times |
Mon 30 June 2025 |
32.80 (-2.67%) |
33.54 |
32.18 - 34.25 |
0.9928 times |
Fri 30 May 2025 |
33.70 (-1.43%) |
34.81 |
32.73 - 35.80 |
1.0137 times |
Wed 30 April 2025 |
34.19 (-1.89%) |
34.82 |
29.37 - 34.89 |
0.945 times |
Mon 31 March 2025 |
34.85 (2.47%) |
33.99 |
32.80 - 35.10 |
0.93 times |
Fri 28 February 2025 |
34.01 (9.18%) |
30.92 |
30.60 - 34.69 |
0.7427 times |
Fri 31 January 2025 |
31.15 (-2.56%) |
31.95 |
30.13 - 32.00 |
1.0221 times |
Tue 31 December 2024 |
31.97 (-6.41%) |
33.92 |
31.54 - 34.02 |
0.731 times |

DMA SMA EMA moving averages of Invitation Homes INVH
DMA (daily moving average) of Invitation Homes INVH
| DMA period | DMA value | | 5 day DMA | 28.54 | | 12 day DMA | 28.51 | | 20 day DMA | 28.84 | | 35 day DMA | 29.43 | | 50 day DMA | 29.75 | | 100 day DMA | 31.17 | | 150 day DMA | 32.02 | | 200 day DMA | 31.97 | EMA (exponential moving average) of Invitation Homes INVH
| EMA period | EMA current | EMA prev | EMA prev2 | | 5 day EMA | 28.57 | 28.51 | 28.47 | | 12 day EMA | 28.65 | 28.64 | 28.65 | | 20 day EMA | 28.86 | 28.88 | 28.91 | | 35 day EMA | 29.24 | 29.27 | 29.31 | | 50 day EMA | 29.68 | 29.72 | 29.77 |
SMA (simple moving average) of Invitation Homes INVH
| SMA period | SMA current | SMA prev | SMA prev2 | | 5 day SMA | 28.54 | 28.5 | 28.43 | | 12 day SMA | 28.51 | 28.57 | 28.6 | | 20 day SMA | 28.84 | 28.88 | 28.94 | | 35 day SMA | 29.43 | 29.5 | 29.57 | | 50 day SMA | 29.75 | 29.79 | 29.82 | | 100 day SMA | 31.17 | 31.21 | 31.26 | | 150 day SMA | 32.02 | 32.05 | 32.08 | | 200 day SMA | 31.97 | 31.99 | 32 |
|
|
