IngredionIncorporated INGR full analysis,charts,indicators,moving averages,SMA,DMA,EMA,ADX,MACD,RSIIngredion Incorporated INGR WideScreen charts, DMA,SMA,EMA technical analysis, forecast prediction, by indicators ADX,MACD,RSI,CCI NYSE stock exchange
operates under Consumer Non Durables sector & deals in Packaged Foods
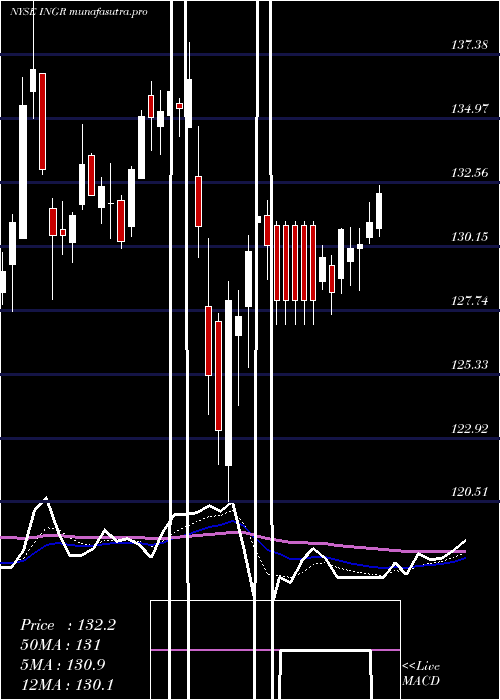
Daily price and charts and targets IngredionIncorporated Strong Daily Stock price targets for IngredionIncorporated INGR are 119.32 and 120.95 | Daily Target 1 | 119.04 | | Daily Target 2 | 119.6 | | Daily Target 3 | 120.66666666667 | | Daily Target 4 | 121.23 | | Daily Target 5 | 122.3 |
Daily price and volume Ingredion Incorporated
| Date |
Closing |
Open |
Range |
Volume |
Tue 21 October 2025 |
120.17 (-1.13%) |
121.55 |
120.10 - 121.73 |
0.9379 times |
Mon 20 October 2025 |
121.54 (0.07%) |
121.52 |
121.07 - 122.07 |
0.5777 times |
Fri 17 October 2025 |
121.45 (0.81%) |
121.04 |
120.27 - 121.54 |
0.908 times |
Thu 16 October 2025 |
120.48 (0.06%) |
120.70 |
120.04 - 121.62 |
0.7407 times |
Wed 15 October 2025 |
120.41 (-0.41%) |
121.70 |
120.06 - 122.74 |
1.2023 times |
Tue 14 October 2025 |
120.91 (0.71%) |
119.56 |
118.56 - 121.00 |
1.213 times |
Mon 13 October 2025 |
120.06 (-0.43%) |
120.00 |
119.55 - 121.08 |
1.1 times |
Tue 07 October 2025 |
120.58 (0.29%) |
120.19 |
119.41 - 121.22 |
1.2858 times |
Mon 06 October 2025 |
120.23 (-0.53%) |
121.50 |
119.91 - 121.50 |
0.7721 times |
Fri 03 October 2025 |
120.87 (1.06%) |
119.31 |
119.31 - 121.55 |
1.2625 times |
Thu 02 October 2025 |
119.60 (-1.68%) |
120.89 |
119.43 - 121.58 |
0.8967 times |
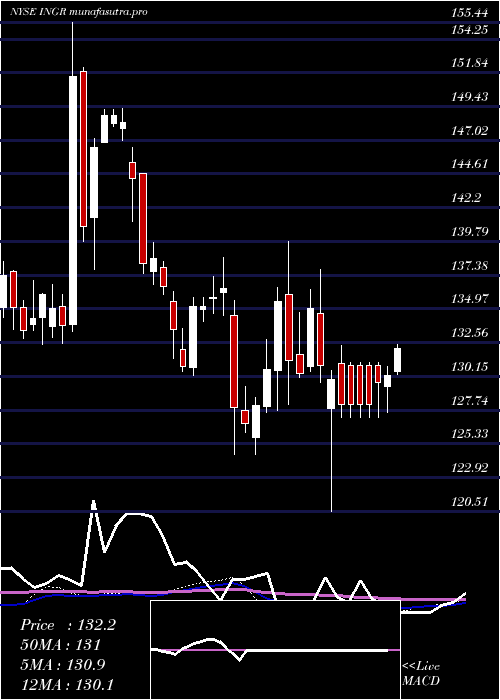
Weekly price and charts IngredionIncorporated Strong weekly Stock price targets for IngredionIncorporated INGR are 119.15 and 121.12 | Weekly Target 1 | 118.81 | | Weekly Target 2 | 119.49 | | Weekly Target 3 | 120.78 | | Weekly Target 4 | 121.46 | | Weekly Target 5 | 122.75 |
Weekly price and volumes for Ingredion Incorporated
| Date |
Closing |
Open |
Range |
Volume |
Tue 21 October 2025 |
120.17 (-1.05%) |
121.52 |
120.10 - 122.07 |
0.3234 times |
Fri 17 October 2025 |
121.45 (0.72%) |
120.00 |
118.56 - 122.74 |
1.1018 times |
Tue 07 October 2025 |
120.58 (-0.24%) |
121.50 |
119.41 - 121.50 |
0.4391 times |
Fri 03 October 2025 |
120.87 (-0.14%) |
121.10 |
119.31 - 122.46 |
1.4019 times |
Fri 26 September 2025 |
121.04 (-1.26%) |
122.16 |
120.48 - 123.50 |
1.6411 times |
Fri 19 September 2025 |
122.59 (-2.8%) |
126.11 |
122.35 - 127.50 |
1.8606 times |
Fri 12 September 2025 |
126.12 (-1.78%) |
128.11 |
125.17 - 128.63 |
0.9689 times |
Fri 05 September 2025 |
128.41 (-0.87%) |
129.50 |
126.94 - 130.45 |
0.9954 times |
Fri 29 August 2025 |
129.54 (0%) |
129.42 |
128.71 - 130.48 |
0.2139 times |
Fri 29 August 2025 |
129.54 (0.39%) |
128.98 |
126.87 - 130.48 |
1.0539 times |
Fri 22 August 2025 |
129.04 (2.47%) |
126.07 |
124.77 - 130.07 |
0.9784 times |
Monthly price and charts IngredionIncorporated Strong monthly Stock price targets for IngredionIncorporated INGR are 117.28 and 121.46 | Monthly Target 1 | 116.31 | | Monthly Target 2 | 118.24 | | Monthly Target 3 | 120.49 | | Monthly Target 4 | 122.42 | | Monthly Target 5 | 124.67 |
Monthly price and volumes Ingredion Incorporated
| Date |
Closing |
Open |
Range |
Volume |
Tue 21 October 2025 |
120.17 (-1.59%) |
121.73 |
118.56 - 122.74 |
0.532 times |
Tue 30 September 2025 |
122.11 (-5.74%) |
129.50 |
120.08 - 130.45 |
1.2225 times |
Fri 29 August 2025 |
129.54 (-1.52%) |
127.85 |
124.08 - 130.67 |
0.8955 times |
Thu 31 July 2025 |
131.54 (-3.01%) |
134.36 |
128.65 - 138.40 |
0.982 times |
Mon 30 June 2025 |
135.62 (-2.52%) |
138.46 |
133.00 - 140.47 |
0.8183 times |
Fri 30 May 2025 |
139.12 (4.74%) |
131.85 |
130.68 - 141.78 |
0.937 times |
Wed 30 April 2025 |
132.82 (-1.77%) |
135.08 |
120.51 - 137.80 |
0.9165 times |
Mon 31 March 2025 |
135.21 (3.52%) |
130.57 |
127.69 - 139.81 |
1.43 times |
Fri 28 February 2025 |
130.61 (-4.27%) |
134.50 |
124.54 - 135.58 |
1.2181 times |
Fri 31 January 2025 |
136.44 (-0.81%) |
137.14 |
130.22 - 138.60 |
1.0481 times |
Tue 31 December 2024 |
137.56 (-7.55%) |
147.88 |
136.34 - 149.29 |
0.8264 times |

DMA SMA EMA moving averages of Ingredion Incorporated INGR
DMA (daily moving average) of Ingredion Incorporated INGR
| DMA period | DMA value | | 5 day DMA | 120.81 | | 12 day DMA | 120.66 | | 20 day DMA | 121.11 | | 35 day DMA | 123.58 | | 50 day DMA | 124.68 | | 100 day DMA | 130.04 | | 150 day DMA | 130.96 | | 200 day DMA | 131.2 | EMA (exponential moving average) of Ingredion Incorporated INGR
| EMA period | EMA current | EMA prev | EMA prev2 | | 5 day EMA | 120.77 | 121.07 | 120.84 | | 12 day EMA | 120.99 | 121.14 | 121.07 | | 20 day EMA | 121.63 | 121.78 | 121.81 | | 35 day EMA | 122.91 | 123.07 | 123.16 | | 50 day EMA | 124.49 | 124.67 | 124.8 |
SMA (simple moving average) of Ingredion Incorporated INGR
| SMA period | SMA current | SMA prev | SMA prev2 | | 5 day SMA | 120.81 | 120.96 | 120.66 | | 12 day SMA | 120.66 | 120.82 | 120.79 | | 20 day SMA | 121.11 | 121.3 | 121.42 | | 35 day SMA | 123.58 | 123.83 | 124.05 | | 50 day SMA | 124.68 | 124.8 | 124.87 | | 100 day SMA | 130.04 | 130.21 | 130.37 | | 150 day SMA | 130.96 | 131.03 | 131.09 | | 200 day SMA | 131.2 | 131.29 | 131.37 |
|
|
