IngGroup ING full analysis,charts,indicators,moving averages,SMA,DMA,EMA,ADX,MACD,RSIIng Group ING WideScreen charts, DMA,SMA,EMA technical analysis, forecast prediction, by indicators ADX,MACD,RSI,CCI NYSE stock exchange
operates under Finance sector & deals in Commercial Banks
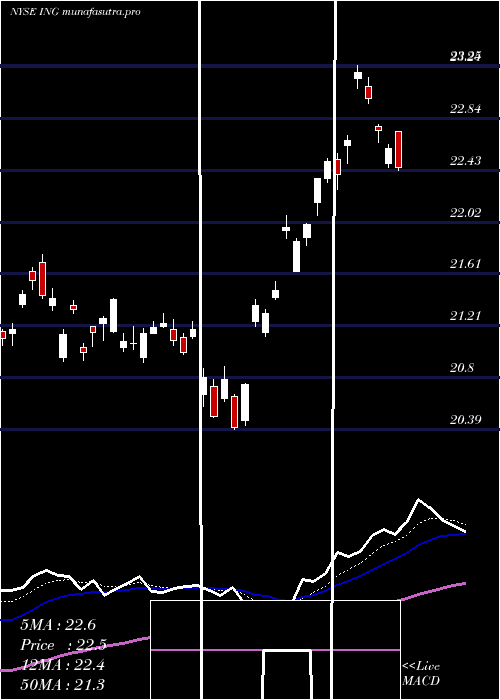
Daily price and charts and targets IngGroup Strong Daily Stock price targets for IngGroup ING are 23.53 and 23.77 | Daily Target 1 | 23.49 | | Daily Target 2 | 23.57 | | Daily Target 3 | 23.726666666667 | | Daily Target 4 | 23.81 | | Daily Target 5 | 23.97 |
Daily price and volume Ing Group
| Date |
Closing |
Open |
Range |
Volume |
Tue 21 October 2025 |
23.66 (-1.42%) |
23.87 |
23.64 - 23.88 |
0.9946 times |
Mon 20 October 2025 |
24.00 (-0.17%) |
24.02 |
23.95 - 24.06 |
0.8269 times |
Fri 17 October 2025 |
24.04 (-1.44%) |
23.93 |
23.86 - 24.16 |
1.3717 times |
Thu 16 October 2025 |
24.39 (0.29%) |
24.44 |
24.29 - 24.57 |
0.7827 times |
Wed 15 October 2025 |
24.32 (-0.98%) |
24.43 |
24.17 - 24.51 |
0.7747 times |
Tue 14 October 2025 |
24.56 (0.99%) |
24.22 |
24.17 - 24.64 |
0.7063 times |
Mon 13 October 2025 |
24.32 (-0.65%) |
24.19 |
24.19 - 24.35 |
0.7142 times |
Tue 07 October 2025 |
24.48 (-3.32%) |
25.40 |
24.17 - 25.46 |
2.6595 times |
Mon 06 October 2025 |
25.32 (-1.78%) |
25.11 |
24.99 - 25.51 |
0.5199 times |
Fri 03 October 2025 |
25.78 (0.04%) |
25.93 |
25.67 - 25.97 |
0.6496 times |
Thu 02 October 2025 |
25.77 (-1.23%) |
26.18 |
25.62 - 26.20 |
0.6952 times |
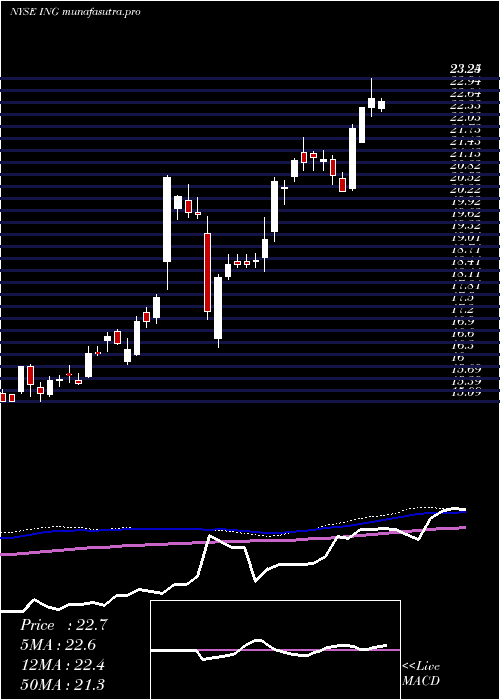
Weekly price and charts IngGroup Strong weekly Stock price targets for IngGroup ING are 23.44 and 23.86 | Weekly Target 1 | 23.37 | | Weekly Target 2 | 23.51 | | Weekly Target 3 | 23.786666666667 | | Weekly Target 4 | 23.93 | | Weekly Target 5 | 24.21 |
Weekly price and volumes for Ing Group
| Date |
Closing |
Open |
Range |
Volume |
Tue 21 October 2025 |
23.66 (-1.58%) |
24.02 |
23.64 - 24.06 |
0.3783 times |
Fri 17 October 2025 |
24.04 (-1.8%) |
24.19 |
23.86 - 24.64 |
0.9035 times |
Tue 07 October 2025 |
24.48 (-5.04%) |
25.11 |
24.17 - 25.51 |
0.6604 times |
Fri 03 October 2025 |
25.78 (-0.69%) |
26.03 |
25.62 - 26.28 |
0.8336 times |
Fri 26 September 2025 |
25.96 (2.12%) |
25.31 |
25.24 - 26.02 |
0.9973 times |
Fri 19 September 2025 |
25.42 (0.08%) |
25.78 |
25.03 - 25.81 |
1.1202 times |
Fri 12 September 2025 |
25.40 (5.39%) |
24.52 |
23.63 - 25.43 |
2.2069 times |
Fri 05 September 2025 |
24.10 (1.13%) |
23.75 |
23.67 - 24.53 |
1.0595 times |
Fri 29 August 2025 |
23.83 (0%) |
23.71 |
23.65 - 23.91 |
0.3989 times |
Fri 29 August 2025 |
23.83 (-4.34%) |
24.86 |
23.65 - 24.92 |
1.4413 times |
Fri 22 August 2025 |
24.91 (0.12%) |
24.60 |
24.59 - 25.10 |
1.6047 times |
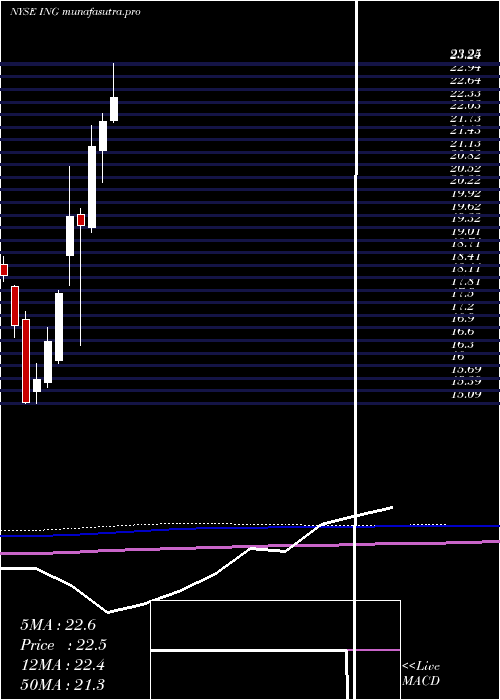
Monthly price and charts IngGroup Strong monthly Stock price targets for IngGroup ING are 22.33 and 24.97 | Monthly Target 1 | 21.89 | | Monthly Target 2 | 22.77 | | Monthly Target 3 | 24.526666666667 | | Monthly Target 4 | 25.41 | | Monthly Target 5 | 27.17 |
Monthly price and volumes Ing Group
| Date |
Closing |
Open |
Range |
Volume |
Tue 21 October 2025 |
23.66 (-9.28%) |
26.20 |
23.64 - 26.28 |
0.4077 times |
Tue 30 September 2025 |
26.08 (9.44%) |
23.75 |
23.63 - 26.11 |
0.9705 times |
Fri 29 August 2025 |
23.83 (2.01%) |
22.91 |
22.54 - 25.11 |
1.1033 times |
Thu 31 July 2025 |
23.36 (6.81%) |
21.90 |
21.84 - 23.90 |
1.1156 times |
Mon 30 June 2025 |
21.87 (2.87%) |
21.16 |
20.39 - 22.07 |
0.8339 times |
Fri 30 May 2025 |
21.26 (9.76%) |
19.31 |
19.20 - 21.76 |
0.8868 times |
Wed 30 April 2025 |
19.37 (-1.12%) |
19.63 |
16.47 - 19.77 |
1.1871 times |
Mon 31 March 2025 |
19.59 (10.49%) |
18.64 |
17.93 - 20.79 |
1.3952 times |
Fri 28 February 2025 |
17.73 (7%) |
16.11 |
16.04 - 17.81 |
0.9979 times |
Fri 31 January 2025 |
16.57 (5.74%) |
15.58 |
15.47 - 16.91 |
1.1021 times |
Tue 31 December 2024 |
15.67 (3.77%) |
15.36 |
15.09 - 16.04 |
0.6446 times |
DMA SMA EMA moving averages of Ing Group ING
DMA (daily moving average) of Ing Group ING
| DMA period | DMA value | | 5 day DMA | 24.08 | | 12 day DMA | 24.73 | | 20 day DMA | 25.14 | | 35 day DMA | 24.93 | | 50 day DMA | 24.82 | | 100 day DMA | 23.47 | | 150 day DMA | 22.18 | | 200 day DMA | 20.9 | EMA (exponential moving average) of Ing Group ING
| EMA period | EMA current | EMA prev | EMA prev2 | | 5 day EMA | 24.06 | 24.26 | 24.39 | | 12 day EMA | 24.52 | 24.68 | 24.8 | | 20 day EMA | 24.75 | 24.86 | 24.95 | | 35 day EMA | 24.75 | 24.81 | 24.86 | | 50 day EMA | 24.62 | 24.66 | 24.69 |
SMA (simple moving average) of Ing Group ING
| SMA period | SMA current | SMA prev | SMA prev2 | | 5 day SMA | 24.08 | 24.26 | 24.33 | | 12 day SMA | 24.73 | 24.93 | 25.1 | | 20 day SMA | 25.14 | 25.22 | 25.29 | | 35 day SMA | 24.93 | 24.94 | 24.94 | | 50 day SMA | 24.82 | 24.83 | 24.82 | | 100 day SMA | 23.47 | 23.45 | 23.42 | | 150 day SMA | 22.18 | 22.16 | 22.13 | | 200 day SMA | 20.9 | 20.86 | 20.82 |
|
|
