MorganStanley IIF full analysis,charts,indicators,moving averages,SMA,DMA,EMA,ADX,MACD,RSIMorgan Stanley IIF WideScreen charts, DMA,SMA,EMA technical analysis, forecast prediction, by indicators ADX,MACD,RSI,CCI NYSE stock exchange
operates under N A sector & deals in N A
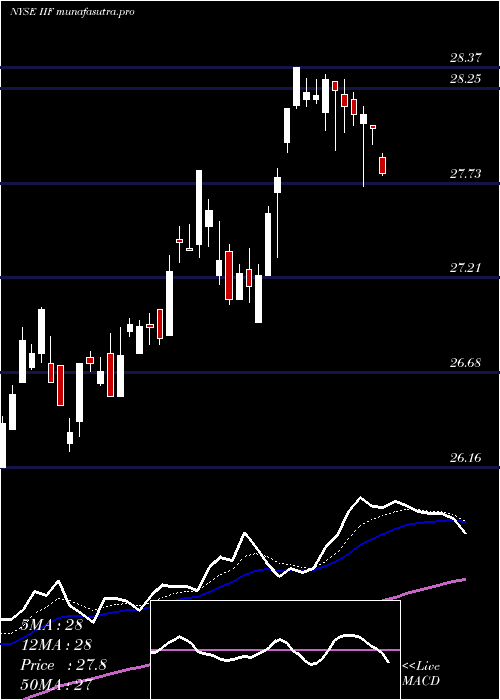
Daily price and charts and targets MorganStanley Strong Daily Stock price targets for MorganStanley IIF are 27.25 and 27.4 | Daily Target 1 | 27.19 | | Daily Target 2 | 27.26 | | Daily Target 3 | 27.343333333333 | | Daily Target 4 | 27.41 | | Daily Target 5 | 27.49 |
Daily price and volume Morgan Stanley
| Date |
Closing |
Open |
Range |
Volume |
Tue 21 October 2025 |
27.32 (-0.36%) |
27.32 |
27.28 - 27.43 |
1.0851 times |
Mon 20 October 2025 |
27.42 (1.03%) |
27.39 |
27.31 - 27.44 |
0.1795 times |
Fri 17 October 2025 |
27.14 (-0.18%) |
27.19 |
26.96 - 27.40 |
1.6236 times |
Thu 16 October 2025 |
27.19 (0.78%) |
27.05 |
27.05 - 27.40 |
0.824 times |
Wed 15 October 2025 |
26.98 (1.43%) |
26.79 |
26.79 - 27.07 |
1.3054 times |
Tue 14 October 2025 |
26.60 (-0.19%) |
26.52 |
26.52 - 26.76 |
0.7996 times |
Mon 13 October 2025 |
26.65 (-0.45%) |
26.62 |
26.52 - 26.83 |
1.4196 times |
Tue 07 October 2025 |
26.77 (0.64%) |
26.75 |
26.61 - 26.95 |
0.5956 times |
Mon 06 October 2025 |
26.60 (0.11%) |
26.61 |
26.60 - 26.70 |
1.6862 times |
Fri 03 October 2025 |
26.57 (-0.11%) |
26.73 |
26.54 - 26.73 |
0.4814 times |
Thu 02 October 2025 |
26.60 (0.11%) |
26.60 |
26.57 - 26.72 |
0.5466 times |
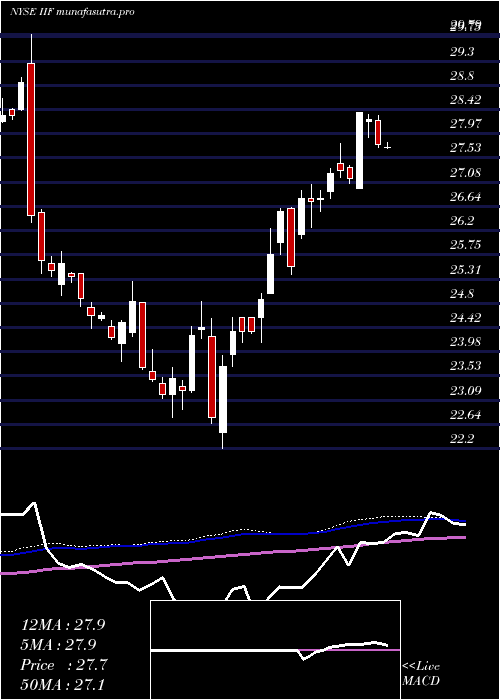
Weekly price and charts MorganStanley Strong weekly Stock price targets for MorganStanley IIF are 27.22 and 27.38 | Weekly Target 1 | 27.19 | | Weekly Target 2 | 27.25 | | Weekly Target 3 | 27.346666666667 | | Weekly Target 4 | 27.41 | | Weekly Target 5 | 27.51 |
Weekly price and volumes for Morgan Stanley
| Date |
Closing |
Open |
Range |
Volume |
Tue 21 October 2025 |
27.32 (0.66%) |
27.39 |
27.28 - 27.44 |
0.3005 times |
Fri 17 October 2025 |
27.14 (1.38%) |
26.62 |
26.52 - 27.40 |
1.4192 times |
Tue 07 October 2025 |
26.77 (0.75%) |
26.61 |
26.60 - 26.95 |
0.5422 times |
Fri 03 October 2025 |
26.57 (0.38%) |
26.33 |
26.26 - 26.73 |
0.9345 times |
Fri 26 September 2025 |
26.47 (-3.08%) |
27.27 |
26.34 - 27.48 |
1.173 times |
Fri 19 September 2025 |
27.31 (0.15%) |
27.25 |
27.01 - 27.51 |
1.3068 times |
Fri 12 September 2025 |
27.27 (2.29%) |
27.07 |
26.76 - 27.53 |
0.7057 times |
Fri 05 September 2025 |
26.66 (1.56%) |
26.19 |
26.10 - 27.14 |
1.5181 times |
Fri 29 August 2025 |
26.25 (0%) |
26.26 |
26.25 - 26.81 |
0.3432 times |
Fri 29 August 2025 |
26.25 (-4.44%) |
27.37 |
26.25 - 27.56 |
1.7566 times |
Fri 22 August 2025 |
27.47 (1.37%) |
27.21 |
27.19 - 27.69 |
1.4231 times |
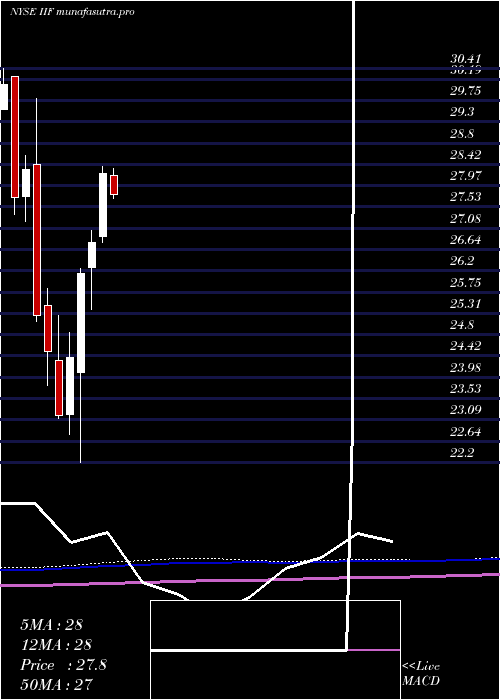
Monthly price and charts MorganStanley Strong monthly Stock price targets for MorganStanley IIF are 26.9 and 27.87 | Monthly Target 1 | 26.11 | | Monthly Target 2 | 26.71 | | Monthly Target 3 | 27.076666666667 | | Monthly Target 4 | 27.68 | | Monthly Target 5 | 28.05 |
Monthly price and volumes Morgan Stanley
| Date |
Closing |
Open |
Range |
Volume |
Tue 21 October 2025 |
27.32 (3.68%) |
26.47 |
26.47 - 27.44 |
0.203 times |
Tue 30 September 2025 |
26.35 (0.38%) |
26.19 |
26.10 - 27.53 |
0.3966 times |
Fri 29 August 2025 |
26.25 (-3.92%) |
27.29 |
26.25 - 27.69 |
0.8318 times |
Thu 31 July 2025 |
27.32 (-3.22%) |
28.19 |
27.06 - 28.33 |
1.0052 times |
Mon 30 June 2025 |
28.23 (5.41%) |
26.91 |
26.79 - 28.37 |
0.6481 times |
Fri 30 May 2025 |
26.78 (2.49%) |
26.26 |
25.39 - 27.04 |
0.9533 times |
Wed 30 April 2025 |
26.13 (7.13%) |
24.07 |
22.20 - 26.25 |
2.0602 times |
Mon 31 March 2025 |
24.39 (5.22%) |
23.19 |
22.77 - 24.90 |
0.7914 times |
Fri 28 February 2025 |
23.18 (-5.43%) |
24.33 |
23.11 - 25.26 |
0.9443 times |
Fri 31 January 2025 |
24.51 (-3.01%) |
25.48 |
23.80 - 25.82 |
2.1661 times |
Tue 31 December 2024 |
25.27 (-10.71%) |
28.41 |
25.14 - 29.79 |
0.9679 times |
DMA SMA EMA moving averages of Morgan Stanley IIF
DMA (daily moving average) of Morgan Stanley IIF
| DMA period | DMA value | | 5 day DMA | 27.21 | | 12 day DMA | 26.87 | | 20 day DMA | 26.82 | | 35 day DMA | 26.85 | | 50 day DMA | 26.92 | | 100 day DMA | 27.19 | | 150 day DMA | 26.46 | | 200 day DMA | 25.89 | EMA (exponential moving average) of Morgan Stanley IIF
| EMA period | EMA current | EMA prev | EMA prev2 | | 5 day EMA | 27.19 | 27.13 | 26.98 | | 12 day EMA | 26.99 | 26.93 | 26.84 | | 20 day EMA | 26.92 | 26.88 | 26.82 | | 35 day EMA | 26.9 | 26.88 | 26.85 | | 50 day EMA | 26.95 | 26.94 | 26.92 |
SMA (simple moving average) of Morgan Stanley IIF
| SMA period | SMA current | SMA prev | SMA prev2 | | 5 day SMA | 27.21 | 27.07 | 26.91 | | 12 day SMA | 26.87 | 26.79 | 26.71 | | 20 day SMA | 26.82 | 26.81 | 26.8 | | 35 day SMA | 26.85 | 26.82 | 26.8 | | 50 day SMA | 26.92 | 26.91 | 26.89 | | 100 day SMA | 27.19 | 27.18 | 27.17 | | 150 day SMA | 26.46 | 26.43 | 26.4 | | 200 day SMA | 25.89 | 25.88 | 25.87 |
|
|
