IhsInc IHS full analysis,charts,indicators,moving averages,SMA,DMA,EMA,ADX,MACD,RSIIhs Inc IHS WideScreen charts, DMA,SMA,EMA technical analysis, forecast prediction, by indicators ADX,MACD,RSI,CCI NYSE stock exchange
Daily price and charts and targets IhsInc Strong Daily Stock price targets for IhsInc IHS are 7.2 and 7.61 | Daily Target 1 | 6.88 | | Daily Target 2 | 7.11 | | Daily Target 3 | 7.2933333333333 | | Daily Target 4 | 7.52 | | Daily Target 5 | 7.7 |
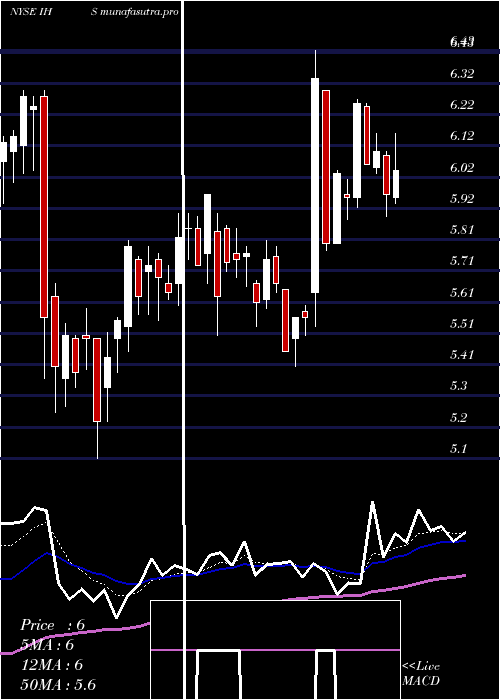
Daily price and volume Ihs Inc
| Date |
Closing |
Open |
Range |
Volume |
Thu 04 December 2025 |
7.33 (3.24%) |
7.08 |
7.07 - 7.48 |
3.5984 times |
Wed 03 December 2025 |
7.10 (1.57%) |
6.97 |
6.93 - 7.10 |
0.5468 times |
Tue 02 December 2025 |
6.99 (-1.41%) |
7.00 |
6.93 - 7.11 |
0.8146 times |
Mon 01 December 2025 |
7.09 (-0.14%) |
7.00 |
6.86 - 7.18 |
0.7172 times |
Fri 28 November 2025 |
7.10 (3.35%) |
6.87 |
6.84 - 7.10 |
0.5375 times |
Wed 26 November 2025 |
6.87 (2.23%) |
6.74 |
6.73 - 7.00 |
0.7529 times |
Tue 25 November 2025 |
6.72 (0.6%) |
6.69 |
6.62 - 6.79 |
0.6371 times |
Mon 24 November 2025 |
6.68 (6.37%) |
6.35 |
6.25 - 6.72 |
0.6599 times |
Fri 21 November 2025 |
6.28 (-0.32%) |
6.31 |
6.22 - 6.38 |
0.8127 times |
Thu 20 November 2025 |
6.30 (-0.47%) |
6.39 |
6.26 - 6.56 |
0.9229 times |
Wed 19 November 2025 |
6.33 (-0.31%) |
6.31 |
6.27 - 6.46 |
0.8994 times |
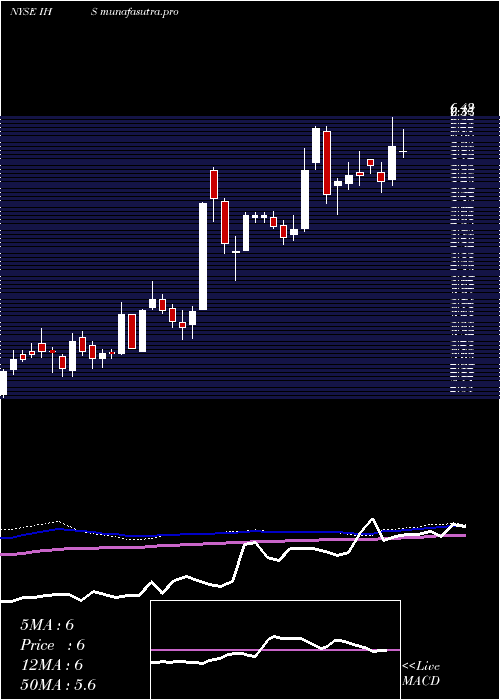
Weekly price and charts IhsInc Strong weekly Stock price targets for IhsInc IHS are 7.1 and 7.72 | Weekly Target 1 | 6.6 | | Weekly Target 2 | 6.97 | | Weekly Target 3 | 7.2233333333333 | | Weekly Target 4 | 7.59 | | Weekly Target 5 | 7.84 |
Weekly price and volumes for Ihs Inc
| Date |
Closing |
Open |
Range |
Volume |
Thu 04 December 2025 |
7.33 (3.24%) |
7.00 |
6.86 - 7.48 |
2.2214 times |
Fri 28 November 2025 |
7.10 (13.06%) |
6.35 |
6.25 - 7.10 |
1.0124 times |
Fri 21 November 2025 |
6.28 (0.64%) |
6.24 |
6.07 - 6.56 |
1.5536 times |
Fri 14 November 2025 |
6.24 (-5.6%) |
6.64 |
5.71 - 8.00 |
2.0662 times |
Fri 07 November 2025 |
6.61 (-3.5%) |
6.69 |
6.34 - 6.75 |
0.5053 times |
Fri 31 October 2025 |
6.85 (0%) |
6.63 |
6.60 - 6.90 |
0.1425 times |
Fri 31 October 2025 |
6.85 (1.03%) |
6.85 |
6.60 - 7.00 |
0.6145 times |
Fri 24 October 2025 |
6.78 (1.95%) |
6.60 |
6.48 - 6.82 |
0.5935 times |
Fri 17 October 2025 |
6.65 (3.42%) |
6.54 |
6.43 - 6.90 |
0.6141 times |
Fri 10 October 2025 |
6.43 (-4.46%) |
6.73 |
6.38 - 6.94 |
0.6765 times |
Fri 03 October 2025 |
6.73 (0.9%) |
6.75 |
6.57 - 7.05 |
0.8624 times |
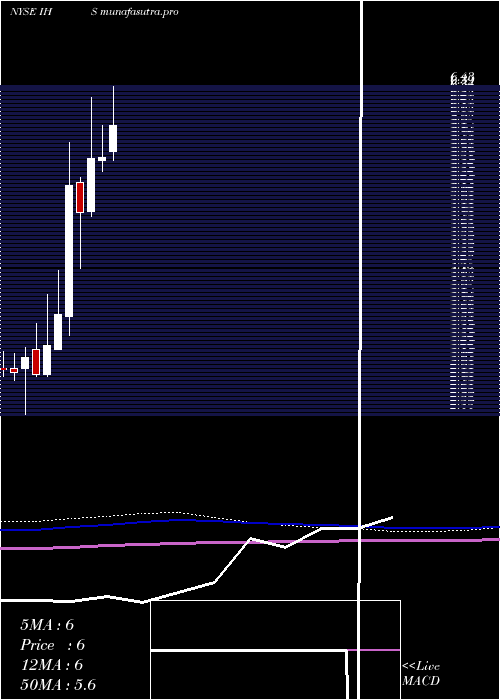
Monthly price and charts IhsInc Strong monthly Stock price targets for IhsInc IHS are 7.1 and 7.72 | Monthly Target 1 | 6.6 | | Monthly Target 2 | 6.97 | | Monthly Target 3 | 7.2233333333333 | | Monthly Target 4 | 7.59 | | Monthly Target 5 | 7.84 |
Monthly price and volumes Ihs Inc
| Date |
Closing |
Open |
Range |
Volume |
Thu 04 December 2025 |
7.33 (3.24%) |
7.00 |
6.86 - 7.48 |
0.432 times |
Fri 28 November 2025 |
7.10 (3.65%) |
6.69 |
5.71 - 8.00 |
0.999 times |
Fri 31 October 2025 |
6.85 (0.44%) |
6.82 |
6.38 - 7.00 |
0.5892 times |
Tue 30 September 2025 |
6.82 (-5.93%) |
7.12 |
6.57 - 7.66 |
0.7358 times |
Fri 29 August 2025 |
7.25 (11.54%) |
6.43 |
6.23 - 7.52 |
0.938 times |
Thu 31 July 2025 |
6.50 (16.91%) |
5.64 |
5.53 - 6.55 |
1.3067 times |
Mon 30 June 2025 |
5.56 (0.18%) |
5.53 |
5.40 - 5.96 |
1.0457 times |
Fri 30 May 2025 |
5.55 (13.27%) |
4.91 |
4.85 - 6.30 |
2.221 times |
Wed 30 April 2025 |
4.90 (-6.13%) |
5.26 |
4.21 - 5.32 |
0.6537 times |
Mon 31 March 2025 |
5.22 (43.01%) |
3.63 |
3.40 - 5.75 |
1.0789 times |
Fri 28 February 2025 |
3.65 (11.28%) |
3.23 |
3.23 - 4.19 |
0.3366 times |
DMA SMA EMA moving averages of Ihs Inc IHS
DMA (daily moving average) of Ihs Inc IHS
| DMA period | DMA value | | 5 day DMA | 7.12 | | 12 day DMA | 6.76 | | 20 day DMA | 6.66 | | 35 day DMA | 6.69 | | 50 day DMA | 6.7 | | 100 day DMA | 6.76 | | 150 day DMA | 6.42 | | 200 day DMA | 5.92 | EMA (exponential moving average) of Ihs Inc IHS
| EMA period | EMA current | EMA prev | EMA prev2 | | 5 day EMA | 7.1 | 6.99 | 6.93 | | 12 day EMA | 6.89 | 6.81 | 6.76 | | 20 day EMA | 6.8 | 6.74 | 6.7 | | 35 day EMA | 6.74 | 6.7 | 6.68 | | 50 day EMA | 6.75 | 6.73 | 6.72 |
SMA (simple moving average) of Ihs Inc IHS
| SMA period | SMA current | SMA prev | SMA prev2 | | 5 day SMA | 7.12 | 7.03 | 6.95 | | 12 day SMA | 6.76 | 6.67 | 6.6 | | 20 day SMA | 6.66 | 6.63 | 6.6 | | 35 day SMA | 6.69 | 6.68 | 6.66 | | 50 day SMA | 6.7 | 6.68 | 6.68 | | 100 day SMA | 6.76 | 6.75 | 6.74 | | 150 day SMA | 6.42 | 6.4 | 6.39 | | 200 day SMA | 5.92 | 5.91 | 5.89 |
|
|
