IntercontinentalHotels IHG full analysis,charts,indicators,moving averages,SMA,DMA,EMA,ADX,MACD,RSIIntercontinental Hotels IHG WideScreen charts, DMA,SMA,EMA technical analysis, forecast prediction, by indicators ADX,MACD,RSI,CCI NYSE stock exchange
operates under Consumer Services sector & deals in Hotels Resorts
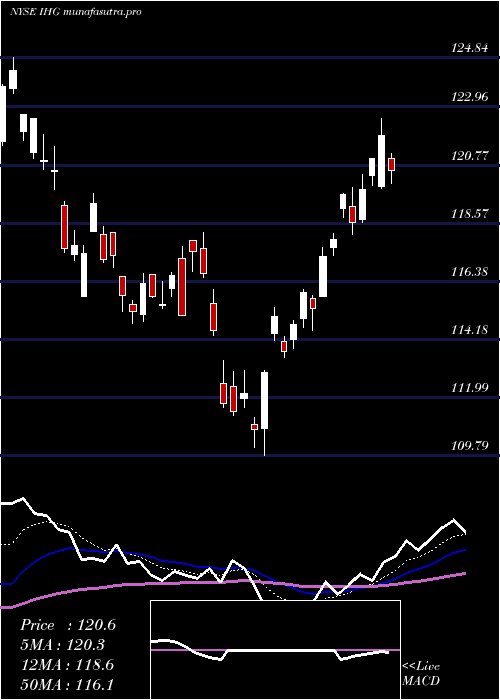
Daily price and charts and targets IntercontinentalHotels Strong Daily Stock price targets for IntercontinentalHotels IHG are 133.35 and 136.18 | Daily Target 1 | 132.82 | | Daily Target 2 | 133.87 | | Daily Target 3 | 135.65333333333 | | Daily Target 4 | 136.7 | | Daily Target 5 | 138.48 |
Daily price and volume Intercontinental Hotels
| Date |
Closing |
Open |
Range |
Volume |
Thu 04 December 2025 |
134.91 (-1.93%) |
137.44 |
134.61 - 137.44 |
1.8275 times |
Wed 03 December 2025 |
137.57 (1.77%) |
136.08 |
135.60 - 137.73 |
1.1304 times |
Tue 02 December 2025 |
135.18 (1.79%) |
134.42 |
133.42 - 135.24 |
0.7744 times |
Mon 01 December 2025 |
132.80 (-1.03%) |
133.54 |
132.36 - 134.36 |
0.7432 times |
Fri 28 November 2025 |
134.18 (-1.08%) |
134.22 |
133.50 - 134.45 |
0.6293 times |
Wed 26 November 2025 |
135.65 (0.74%) |
134.88 |
134.82 - 135.98 |
0.7947 times |
Tue 25 November 2025 |
134.66 (2.69%) |
131.47 |
131.47 - 134.71 |
0.8842 times |
Mon 24 November 2025 |
131.13 (0.44%) |
131.40 |
130.40 - 131.46 |
0.9141 times |
Fri 21 November 2025 |
130.56 (4.73%) |
126.80 |
126.42 - 130.81 |
1.3874 times |
Thu 20 November 2025 |
124.66 (-0.9%) |
126.34 |
124.51 - 127.01 |
0.9148 times |
Wed 19 November 2025 |
125.79 (-0.34%) |
126.36 |
125.31 - 126.49 |
0.6171 times |
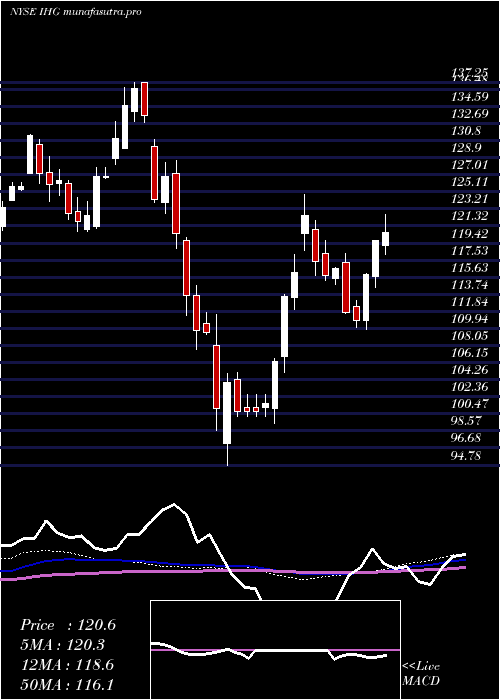
Weekly price and charts IntercontinentalHotels Strong weekly Stock price targets for IntercontinentalHotels IHG are 133.64 and 139.01 | Weekly Target 1 | 129.63 | | Weekly Target 2 | 132.27 | | Weekly Target 3 | 135 | | Weekly Target 4 | 137.64 | | Weekly Target 5 | 140.37 |
Weekly price and volumes for Intercontinental Hotels
| Date |
Closing |
Open |
Range |
Volume |
Thu 04 December 2025 |
134.91 (0.54%) |
133.54 |
132.36 - 137.73 |
0.9981 times |
Fri 28 November 2025 |
134.18 (2.77%) |
131.40 |
130.40 - 135.98 |
0.7187 times |
Fri 21 November 2025 |
130.56 (1.27%) |
128.87 |
124.51 - 130.81 |
1.1612 times |
Fri 14 November 2025 |
128.92 (-0.97%) |
131.91 |
128.48 - 132.73 |
1.1763 times |
Fri 07 November 2025 |
130.18 (7.18%) |
121.45 |
121.20 - 130.28 |
1.06 times |
Fri 31 October 2025 |
121.46 (0%) |
121.80 |
120.16 - 122.03 |
0.3537 times |
Fri 31 October 2025 |
121.46 (-2.36%) |
126.03 |
120.16 - 126.94 |
1.4493 times |
Fri 24 October 2025 |
124.39 (2.96%) |
121.09 |
120.14 - 126.11 |
1.2052 times |
Fri 17 October 2025 |
120.81 (-1.94%) |
121.17 |
118.47 - 122.83 |
1.3847 times |
Tue 07 October 2025 |
123.20 (-0.58%) |
124.29 |
122.97 - 124.65 |
0.4929 times |
Fri 03 October 2025 |
123.92 (0.56%) |
124.43 |
120.93 - 124.74 |
1.37 times |
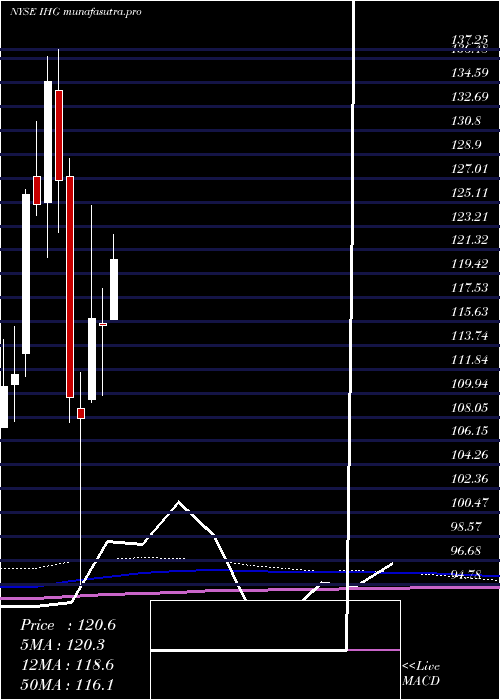
Monthly price and charts IntercontinentalHotels Strong monthly Stock price targets for IntercontinentalHotels IHG are 133.64 and 139.01 | Monthly Target 1 | 129.63 | | Monthly Target 2 | 132.27 | | Monthly Target 3 | 135 | | Monthly Target 4 | 137.64 | | Monthly Target 5 | 140.37 |
Monthly price and volumes Intercontinental Hotels
| Date |
Closing |
Open |
Range |
Volume |
Thu 04 December 2025 |
134.91 (0.54%) |
133.54 |
132.36 - 137.73 |
0.1696 times |
Fri 28 November 2025 |
134.18 (10.47%) |
121.45 |
121.20 - 135.98 |
0.6995 times |
Fri 31 October 2025 |
121.46 (0.16%) |
122.63 |
118.47 - 126.94 |
0.9827 times |
Tue 30 September 2025 |
121.26 (-1.13%) |
118.91 |
117.29 - 125.32 |
0.8595 times |
Fri 29 August 2025 |
122.64 (5.58%) |
114.91 |
113.32 - 126.84 |
1.0683 times |
Thu 31 July 2025 |
116.16 (0.71%) |
115.82 |
115.13 - 122.55 |
1.0342 times |
Mon 30 June 2025 |
115.34 (-0.43%) |
115.51 |
109.79 - 118.23 |
1.211 times |
Fri 30 May 2025 |
115.84 (7.37%) |
109.40 |
109.19 - 124.84 |
1.2653 times |
Wed 30 April 2025 |
107.89 (-1.55%) |
108.70 |
94.78 - 111.54 |
1.6016 times |
Mon 31 March 2025 |
109.59 (-13.6%) |
127.18 |
107.57 - 128.54 |
1.1083 times |
Fri 28 February 2025 |
126.84 (-5.85%) |
134.00 |
122.73 - 137.25 |
1.4079 times |
DMA SMA EMA moving averages of Intercontinental Hotels IHG
DMA (daily moving average) of Intercontinental Hotels IHG
| DMA period | DMA value | | 5 day DMA | 134.93 | | 12 day DMA | 131.94 | | 20 day DMA | 131.04 | | 35 day DMA | 127.49 | | 50 day DMA | 125.67 | | 100 day DMA | 122.8 | | 150 day DMA | 120.63 | | 200 day DMA | 118.79 | EMA (exponential moving average) of Intercontinental Hotels IHG
| EMA period | EMA current | EMA prev | EMA prev2 | | 5 day EMA | 134.96 | 134.98 | 133.69 | | 12 day EMA | 132.93 | 132.57 | 131.66 | | 20 day EMA | 131.1 | 130.7 | 129.98 | | 35 day EMA | 128.6 | 128.23 | 127.68 | | 50 day EMA | 126.08 | 125.72 | 125.24 |
SMA (simple moving average) of Intercontinental Hotels IHG
| SMA period | SMA current | SMA prev | SMA prev2 | | 5 day SMA | 134.93 | 135.08 | 134.49 | | 12 day SMA | 131.94 | 131.3 | 130.57 | | 20 day SMA | 131.04 | 130.59 | 129.82 | | 35 day SMA | 127.49 | 127.07 | 126.64 | | 50 day SMA | 125.67 | 125.37 | 124.98 | | 100 day SMA | 122.8 | 122.67 | 122.51 | | 150 day SMA | 120.63 | 120.44 | 120.22 | | 200 day SMA | 118.79 | 118.79 | 118.78 |
|
|
