IntercorpFinancial IFS full analysis,charts,indicators,moving averages,SMA,DMA,EMA,ADX,MACD,RSIIntercorp Financial IFS WideScreen charts, DMA,SMA,EMA technical analysis, forecast prediction, by indicators ADX,MACD,RSI,CCI NYSE stock exchange
Daily price and charts and targets IntercorpFinancial Strong Daily Stock price targets for IntercorpFinancial IFS are 40.97 and 41.54 | Daily Target 1 | 40.54 | | Daily Target 2 | 40.83 | | Daily Target 3 | 41.11 | | Daily Target 4 | 41.4 | | Daily Target 5 | 41.68 |
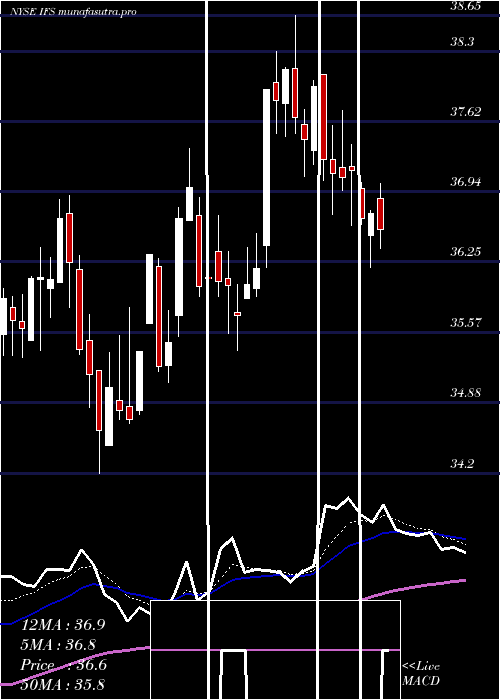
Daily price and volume Intercorp Financial
| Date |
Closing |
Open |
Range |
Volume |
Mon 20 October 2025 |
41.12 (0.59%) |
40.82 |
40.82 - 41.39 |
1.132 times |
Fri 17 October 2025 |
40.88 (1.89%) |
40.06 |
39.77 - 40.94 |
2.814 times |
Thu 16 October 2025 |
40.12 (-1.69%) |
40.76 |
39.96 - 40.78 |
0.3748 times |
Wed 15 October 2025 |
40.81 (1.57%) |
40.30 |
40.05 - 40.97 |
0.4849 times |
Tue 14 October 2025 |
40.18 (-1.47%) |
40.77 |
40.18 - 41.12 |
0.5284 times |
Mon 13 October 2025 |
40.78 (1.42%) |
40.22 |
39.87 - 40.85 |
0.6919 times |
Tue 07 October 2025 |
40.21 (-0.4%) |
40.32 |
40.01 - 40.61 |
0.5314 times |
Mon 06 October 2025 |
40.37 (-1.46%) |
40.97 |
40.12 - 41.18 |
0.3071 times |
Fri 03 October 2025 |
40.97 (0.96%) |
40.78 |
40.50 - 41.00 |
0.7594 times |
Thu 02 October 2025 |
40.58 (1.45%) |
39.97 |
39.50 - 40.99 |
2.3762 times |
Wed 01 October 2025 |
40.00 (-0.84%) |
40.21 |
39.78 - 40.49 |
0.8261 times |
Weekly price and charts IntercorpFinancial Strong weekly Stock price targets for IntercorpFinancial IFS are 40.97 and 41.54 | Weekly Target 1 | 40.54 | | Weekly Target 2 | 40.83 | | Weekly Target 3 | 41.11 | | Weekly Target 4 | 41.4 | | Weekly Target 5 | 41.68 |
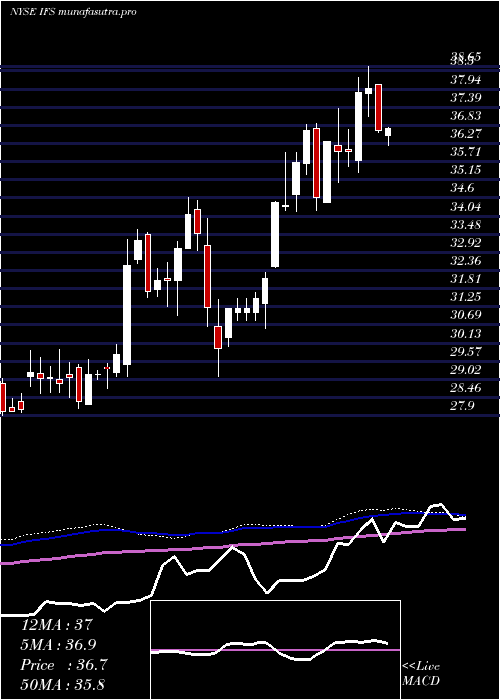
Weekly price and volumes for Intercorp Financial
| Date |
Closing |
Open |
Range |
Volume |
Mon 20 October 2025 |
41.12 (0.59%) |
40.82 |
40.82 - 41.39 |
0.3444 times |
Fri 17 October 2025 |
40.88 (1.67%) |
40.22 |
39.77 - 41.12 |
1.489 times |
Tue 07 October 2025 |
40.21 (-1.86%) |
40.97 |
40.01 - 41.18 |
0.2551 times |
Fri 03 October 2025 |
40.97 (2.02%) |
40.15 |
39.50 - 41.00 |
1.7138 times |
Fri 26 September 2025 |
40.16 (0.2%) |
40.11 |
39.84 - 41.16 |
1.1015 times |
Fri 19 September 2025 |
40.08 (-4.48%) |
41.96 |
38.63 - 41.98 |
1.9009 times |
Fri 12 September 2025 |
41.96 (2.74%) |
40.87 |
40.47 - 42.21 |
1.1552 times |
Fri 05 September 2025 |
40.84 (2.82%) |
39.32 |
39.01 - 41.52 |
0.8702 times |
Fri 29 August 2025 |
39.72 (0%) |
39.98 |
39.68 - 40.02 |
0.1613 times |
Fri 29 August 2025 |
39.72 (-1%) |
39.95 |
38.96 - 40.06 |
1.0086 times |
Fri 22 August 2025 |
40.12 (3.78%) |
38.53 |
38.00 - 40.12 |
0.8397 times |
Monthly price and charts IntercorpFinancial Strong monthly Stock price targets for IntercorpFinancial IFS are 40.31 and 42.2 | Monthly Target 1 | 38.78 | | Monthly Target 2 | 39.95 | | Monthly Target 3 | 40.67 | | Monthly Target 4 | 41.84 | | Monthly Target 5 | 42.56 |
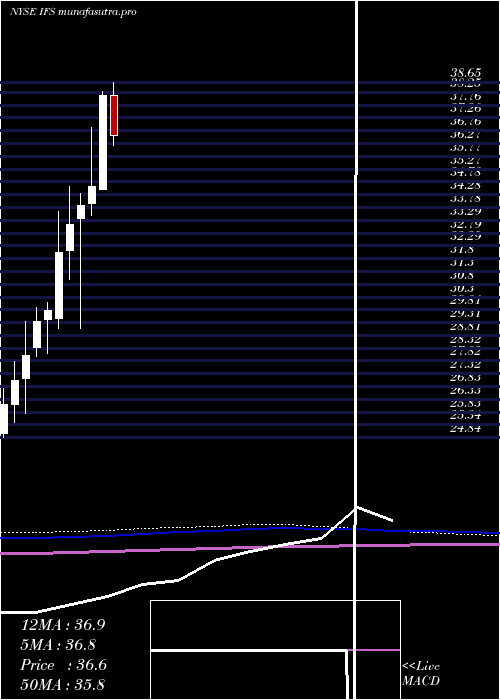
Monthly price and volumes Intercorp Financial
| Date |
Closing |
Open |
Range |
Volume |
Mon 20 October 2025 |
41.12 (1.93%) |
40.21 |
39.50 - 41.39 |
0.6245 times |
Tue 30 September 2025 |
40.34 (1.56%) |
39.32 |
38.63 - 42.21 |
1.0495 times |
Fri 29 August 2025 |
39.72 (10.15%) |
35.98 |
35.45 - 40.24 |
1.0944 times |
Thu 31 July 2025 |
36.06 (-5.43%) |
38.14 |
35.65 - 38.65 |
0.9026 times |
Mon 30 June 2025 |
38.13 (10.17%) |
34.47 |
34.47 - 38.30 |
1.3532 times |
Fri 30 May 2025 |
34.61 (2.18%) |
33.94 |
33.48 - 36.90 |
1.1678 times |
Wed 30 April 2025 |
33.87 (2.23%) |
33.36 |
29.09 - 34.33 |
1.1111 times |
Mon 31 March 2025 |
33.13 (3.4%) |
32.11 |
30.99 - 34.60 |
0.8117 times |
Fri 28 February 2025 |
32.04 (7.59%) |
29.46 |
29.09 - 33.62 |
1.0693 times |
Fri 31 January 2025 |
29.78 (1.5%) |
29.43 |
28.11 - 30.10 |
0.816 times |
Tue 31 December 2024 |
29.34 (4.67%) |
28.34 |
28.00 - 29.90 |
0.4392 times |
DMA SMA EMA moving averages of Intercorp Financial IFS
DMA (daily moving average) of Intercorp Financial IFS
| DMA period | DMA value | | 5 day DMA | 40.62 | | 12 day DMA | 40.53 | | 20 day DMA | 40.41 | | 35 day DMA | 40.64 | | 50 day DMA | 40.06 | | 100 day DMA | 38.24 | | 150 day DMA | 36.52 | | 200 day DMA | 35.05 | EMA (exponential moving average) of Intercorp Financial IFS
| EMA period | EMA current | EMA prev | EMA prev2 | | 5 day EMA | 40.75 | 40.56 | 40.4 | | 12 day EMA | 40.6 | 40.51 | 40.44 | | 20 day EMA | 40.52 | 40.46 | 40.42 | | 35 day EMA | 40.1 | 40.04 | 39.99 | | 50 day EMA | 39.79 | 39.74 | 39.69 |
SMA (simple moving average) of Intercorp Financial IFS
| SMA period | SMA current | SMA prev | SMA prev2 | | 5 day SMA | 40.62 | 40.55 | 40.42 | | 12 day SMA | 40.53 | 40.45 | 40.39 | | 20 day SMA | 40.41 | 40.44 | 40.46 | | 35 day SMA | 40.64 | 40.59 | 40.55 | | 50 day SMA | 40.06 | 39.96 | 39.87 | | 100 day SMA | 38.24 | 38.18 | 38.14 | | 150 day SMA | 36.52 | 36.45 | 36.39 | | 200 day SMA | 35.05 | 34.99 | 34.93 |
|
|
