VoyaInfrastructure IDE full analysis,charts,indicators,moving averages,SMA,DMA,EMA,ADX,MACD,RSIVoya Infrastructure IDE WideScreen charts, DMA,SMA,EMA technical analysis, forecast prediction, by indicators ADX,MACD,RSI,CCI NYSE stock exchange
operates under N A sector & deals in N A
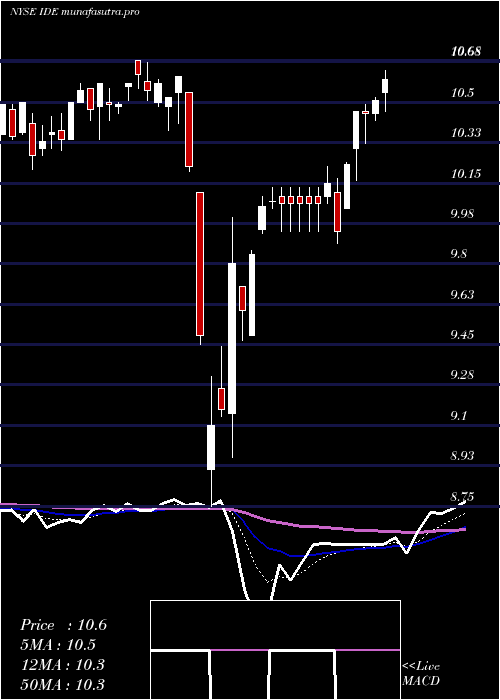
Daily price and charts and targets VoyaInfrastructure Strong Daily Stock price targets for VoyaInfrastructure IDE are 11.92 and 12 | Daily Target 1 | 11.85 | | Daily Target 2 | 11.9 | | Daily Target 3 | 11.933333333333 | | Daily Target 4 | 11.98 | | Daily Target 5 | 12.01 |
Daily price and volume Voya Infrastructure
| Date |
Closing |
Open |
Range |
Volume |
Fri 05 December 2025 |
11.94 (0.51%) |
11.92 |
11.89 - 11.97 |
1.0332 times |
Thu 04 December 2025 |
11.88 (0.42%) |
11.83 |
11.77 - 11.90 |
0.9663 times |
Wed 03 December 2025 |
11.83 (0.94%) |
11.68 |
11.64 - 11.83 |
0.9997 times |
Tue 02 December 2025 |
11.72 (0.34%) |
11.63 |
11.61 - 11.75 |
1.0743 times |
Mon 01 December 2025 |
11.68 (-1.18%) |
11.66 |
11.60 - 11.78 |
1.0717 times |
Fri 28 November 2025 |
11.82 (0.85%) |
11.74 |
11.73 - 11.87 |
1.01 times |
Wed 26 November 2025 |
11.72 (0.6%) |
11.68 |
11.67 - 11.79 |
1.0691 times |
Tue 25 November 2025 |
11.65 (0.26%) |
11.57 |
11.54 - 11.66 |
1.1128 times |
Mon 24 November 2025 |
11.62 (1.13%) |
11.54 |
11.49 - 11.63 |
0.8044 times |
Fri 21 November 2025 |
11.49 (1.14%) |
11.37 |
11.37 - 11.50 |
0.8584 times |
Thu 20 November 2025 |
11.36 (-1.73%) |
11.64 |
11.36 - 11.67 |
1.8607 times |
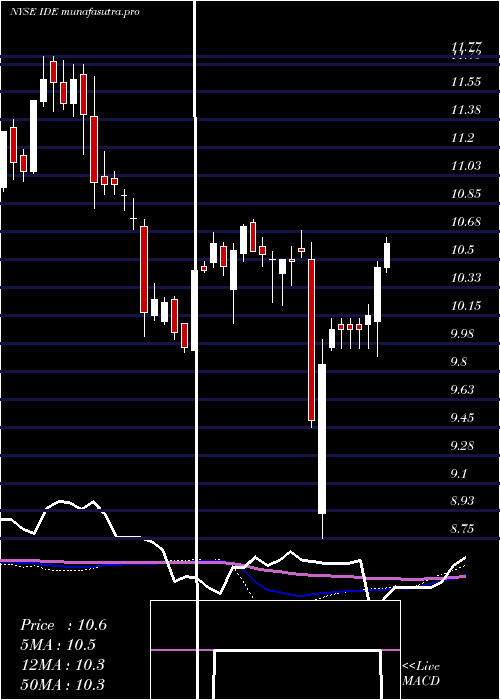
Weekly price and charts VoyaInfrastructure Strong weekly Stock price targets for VoyaInfrastructure IDE are 11.77 and 12.14 | Weekly Target 1 | 11.47 | | Weekly Target 2 | 11.7 | | Weekly Target 3 | 11.836666666667 | | Weekly Target 4 | 12.07 | | Weekly Target 5 | 12.21 |
Weekly price and volumes for Voya Infrastructure
| Date |
Closing |
Open |
Range |
Volume |
Fri 05 December 2025 |
11.94 (1.02%) |
11.66 |
11.60 - 11.97 |
1.1025 times |
Fri 28 November 2025 |
11.82 (2.87%) |
11.54 |
11.49 - 11.87 |
0.8563 times |
Fri 21 November 2025 |
11.49 (-3.12%) |
11.84 |
11.36 - 11.85 |
1.4687 times |
Fri 14 November 2025 |
11.86 (0.17%) |
11.80 |
11.63 - 11.95 |
1.9836 times |
Fri 07 November 2025 |
11.84 (-3.82%) |
12.08 |
11.72 - 12.29 |
0.9538 times |
Fri 31 October 2025 |
12.31 (0%) |
12.40 |
12.29 - 12.42 |
0.1426 times |
Fri 31 October 2025 |
12.31 (0.08%) |
12.35 |
12.18 - 12.42 |
1.0089 times |
Fri 24 October 2025 |
12.30 (0.65%) |
12.29 |
12.13 - 12.35 |
0.8315 times |
Fri 17 October 2025 |
12.22 (-0.08%) |
11.90 |
11.88 - 12.29 |
1.1994 times |
Tue 07 October 2025 |
12.23 (0.82%) |
12.14 |
12.12 - 12.28 |
0.4526 times |
Fri 03 October 2025 |
12.13 (0.41%) |
12.08 |
12.01 - 12.27 |
1.2067 times |
Monthly price and charts VoyaInfrastructure Strong monthly Stock price targets for VoyaInfrastructure IDE are 11.77 and 12.14 | Monthly Target 1 | 11.47 | | Monthly Target 2 | 11.7 | | Monthly Target 3 | 11.836666666667 | | Monthly Target 4 | 12.07 | | Monthly Target 5 | 12.21 |
Monthly price and volumes Voya Infrastructure
| Date |
Closing |
Open |
Range |
Volume |
Fri 05 December 2025 |
11.94 (1.02%) |
11.66 |
11.60 - 11.97 |
0.2227 times |
Fri 28 November 2025 |
11.82 (-3.98%) |
12.08 |
11.36 - 12.29 |
1.063 times |
Fri 31 October 2025 |
12.31 (1.48%) |
12.05 |
11.88 - 12.42 |
0.8631 times |
Tue 30 September 2025 |
12.13 (-3.12%) |
12.38 |
12.01 - 12.54 |
0.9989 times |
Fri 29 August 2025 |
12.52 (5.3%) |
11.76 |
11.71 - 12.54 |
1.4535 times |
Thu 31 July 2025 |
11.89 (1.71%) |
11.61 |
11.57 - 11.90 |
0.9708 times |
Mon 30 June 2025 |
11.69 (2.9%) |
11.30 |
11.21 - 11.74 |
0.9583 times |
Fri 30 May 2025 |
11.36 (6.97%) |
10.61 |
10.40 - 11.46 |
1.2738 times |
Wed 30 April 2025 |
10.62 (0.38%) |
10.48 |
8.75 - 10.64 |
1.374 times |
Mon 31 March 2025 |
10.58 (0.47%) |
10.50 |
10.21 - 10.68 |
0.8219 times |
Fri 28 February 2025 |
10.53 (0.67%) |
10.31 |
10.10 - 10.75 |
0.9617 times |

DMA SMA EMA moving averages of Voya Infrastructure IDE
DMA (daily moving average) of Voya Infrastructure IDE
| DMA period | DMA value | | 5 day DMA | 11.81 | | 12 day DMA | 11.69 | | 20 day DMA | 11.72 | | 35 day DMA | 11.92 | | 50 day DMA | 11.99 | | 100 day DMA | 12.07 | | 150 day DMA | 11.8 | | 200 day DMA | 11.42 | EMA (exponential moving average) of Voya Infrastructure IDE
| EMA period | EMA current | EMA prev | EMA prev2 | | 5 day EMA | 11.84 | 11.79 | 11.74 | | 12 day EMA | 11.78 | 11.75 | 11.73 | | 20 day EMA | 11.8 | 11.79 | 11.78 | | 35 day EMA | 11.87 | 11.87 | 11.87 | | 50 day EMA | 12 | 12 | 12.01 |
SMA (simple moving average) of Voya Infrastructure IDE
| SMA period | SMA current | SMA prev | SMA prev2 | | 5 day SMA | 11.81 | 11.79 | 11.75 | | 12 day SMA | 11.69 | 11.66 | 11.65 | | 20 day SMA | 11.72 | 11.72 | 11.72 | | 35 day SMA | 11.92 | 11.93 | 11.94 | | 50 day SMA | 11.99 | 11.99 | 12 | | 100 day SMA | 12.07 | 12.06 | 12.06 | | 150 day SMA | 11.8 | 11.79 | 11.78 | | 200 day SMA | 11.42 | 11.42 | 11.41 |
|
|
