MarinemaxInc HZO full analysis,charts,indicators,moving averages,SMA,DMA,EMA,ADX,MACD,RSIMarinemax Inc HZO WideScreen charts, DMA,SMA,EMA technical analysis, forecast prediction, by indicators ADX,MACD,RSI,CCI NYSE stock exchange
operates under Consumer Services sector & deals in Other Specialty Stores
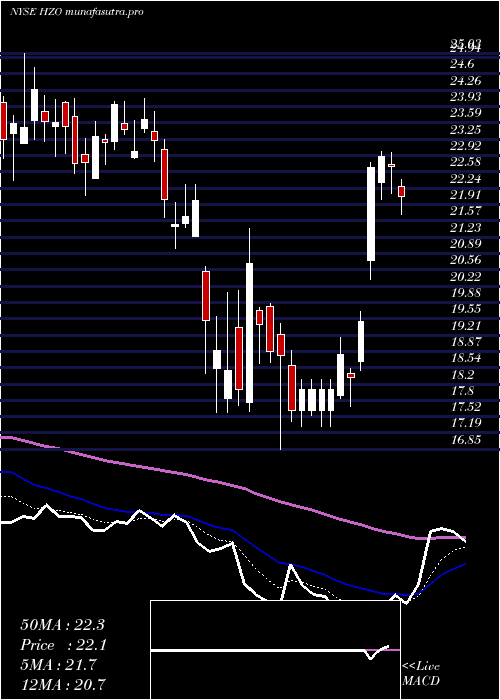
Daily price and charts and targets MarinemaxInc Strong Daily Stock price targets for MarinemaxInc HZO are 25.86 and 26.45 | Daily Target 1 | 25.45 | | Daily Target 2 | 25.68 | | Daily Target 3 | 26.043333333333 | | Daily Target 4 | 26.27 | | Daily Target 5 | 26.63 |
Daily price and volume Marinemax Inc
| Date |
Closing |
Open |
Range |
Volume |
Mon 20 October 2025 |
25.90 (1.49%) |
25.82 |
25.82 - 26.41 |
0.4949 times |
Fri 17 October 2025 |
25.52 (-1.73%) |
25.67 |
25.45 - 26.18 |
0.6914 times |
Thu 16 October 2025 |
25.97 (-3.24%) |
26.95 |
25.45 - 26.95 |
1.5652 times |
Wed 15 October 2025 |
26.84 (-1.07%) |
27.45 |
26.69 - 27.62 |
0.8543 times |
Tue 14 October 2025 |
27.13 (7.87%) |
24.91 |
24.77 - 27.53 |
1.268 times |
Mon 13 October 2025 |
25.15 (-1.37%) |
24.41 |
24.26 - 25.31 |
1.243 times |
Tue 07 October 2025 |
25.50 (-3.15%) |
26.34 |
25.38 - 26.34 |
0.785 times |
Mon 06 October 2025 |
26.33 (-6.43%) |
28.29 |
26.26 - 28.29 |
0.7171 times |
Fri 03 October 2025 |
28.14 (8.73%) |
26.20 |
26.08 - 28.23 |
1.9169 times |
Thu 02 October 2025 |
25.88 (0.15%) |
25.93 |
25.41 - 26.30 |
0.4642 times |
Wed 01 October 2025 |
25.84 (2.01%) |
25.21 |
25.20 - 26.07 |
1.1651 times |
Weekly price and charts MarinemaxInc Strong weekly Stock price targets for MarinemaxInc HZO are 25.86 and 26.45 | Weekly Target 1 | 25.45 | | Weekly Target 2 | 25.68 | | Weekly Target 3 | 26.043333333333 | | Weekly Target 4 | 26.27 | | Weekly Target 5 | 26.63 |
Weekly price and volumes for Marinemax Inc
| Date |
Closing |
Open |
Range |
Volume |
Mon 20 October 2025 |
25.90 (1.49%) |
25.82 |
25.82 - 26.41 |
0.1219 times |
Fri 17 October 2025 |
25.52 (0.08%) |
24.41 |
24.26 - 27.62 |
1.3846 times |
Tue 07 October 2025 |
25.50 (-9.38%) |
28.29 |
25.38 - 28.29 |
0.37 times |
Fri 03 October 2025 |
28.14 (7.36%) |
26.37 |
24.84 - 28.23 |
1.4683 times |
Fri 26 September 2025 |
26.21 (3.76%) |
25.21 |
24.99 - 27.07 |
1.7082 times |
Fri 19 September 2025 |
25.26 (-2.55%) |
26.05 |
25.01 - 27.73 |
1.8098 times |
Fri 12 September 2025 |
25.92 (-2.04%) |
26.48 |
24.71 - 26.84 |
1.0503 times |
Fri 05 September 2025 |
26.46 (0.42%) |
25.80 |
24.89 - 27.00 |
0.7361 times |
Fri 29 August 2025 |
26.35 (0%) |
27.57 |
26.31 - 27.57 |
0.1841 times |
Fri 29 August 2025 |
26.35 (-6.13%) |
27.89 |
26.31 - 28.21 |
1.1668 times |
Fri 22 August 2025 |
28.07 (10.64%) |
25.46 |
24.87 - 28.35 |
1.0773 times |
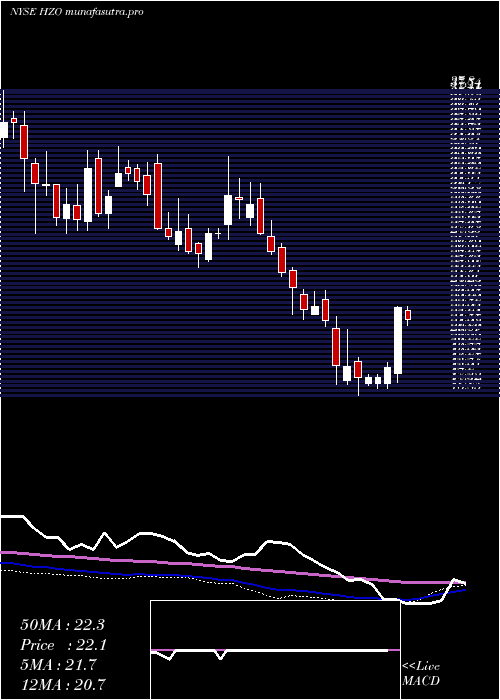
Monthly price and charts MarinemaxInc Strong monthly Stock price targets for MarinemaxInc HZO are 25.08 and 29.11 | Monthly Target 1 | 22.12 | | Monthly Target 2 | 24.01 | | Monthly Target 3 | 26.15 | | Monthly Target 4 | 28.04 | | Monthly Target 5 | 30.18 |
Monthly price and volumes Marinemax Inc
| Date |
Closing |
Open |
Range |
Volume |
Mon 20 October 2025 |
25.90 (2.25%) |
25.21 |
24.26 - 28.29 |
0.5488 times |
Tue 30 September 2025 |
25.33 (-3.87%) |
25.80 |
24.71 - 27.73 |
1.1773 times |
Fri 29 August 2025 |
26.35 (16.18%) |
22.23 |
21.41 - 28.35 |
0.9993 times |
Thu 31 July 2025 |
22.68 (-9.79%) |
24.90 |
21.64 - 28.49 |
1.217 times |
Mon 30 June 2025 |
25.14 (18.58%) |
21.17 |
20.52 - 26.36 |
0.9661 times |
Fri 30 May 2025 |
21.20 (-1.21%) |
21.70 |
20.69 - 25.07 |
0.8945 times |
Wed 30 April 2025 |
21.46 (-0.19%) |
21.51 |
16.85 - 23.01 |
1.5286 times |
Mon 31 March 2025 |
21.50 (-15.19%) |
25.44 |
21.00 - 25.70 |
1.0232 times |
Fri 28 February 2025 |
25.35 (-16.5%) |
29.10 |
25.07 - 31.51 |
0.6683 times |
Fri 31 January 2025 |
30.36 (4.87%) |
29.12 |
25.70 - 33.28 |
0.977 times |
Tue 31 December 2024 |
28.95 (-9.98%) |
32.48 |
26.81 - 33.45 |
0.592 times |

DMA SMA EMA moving averages of Marinemax Inc HZO
DMA (daily moving average) of Marinemax Inc HZO
| DMA period | DMA value | | 5 day DMA | 26.27 | | 12 day DMA | 26.13 | | 20 day DMA | 26.01 | | 35 day DMA | 26.04 | | 50 day DMA | 25.94 | | 100 day DMA | 25.13 | | 150 day DMA | 23.88 | | 200 day DMA | 24.86 | EMA (exponential moving average) of Marinemax Inc HZO
| EMA period | EMA current | EMA prev | EMA prev2 | | 5 day EMA | 25.99 | 26.03 | 26.29 | | 12 day EMA | 26.07 | 26.1 | 26.2 | | 20 day EMA | 26.04 | 26.05 | 26.11 | | 35 day EMA | 25.86 | 25.86 | 25.88 | | 50 day EMA | 25.72 | 25.71 | 25.72 |
SMA (simple moving average) of Marinemax Inc HZO
| SMA period | SMA current | SMA prev | SMA prev2 | | 5 day SMA | 26.27 | 26.12 | 26.12 | | 12 day SMA | 26.13 | 26.13 | 26.19 | | 20 day SMA | 26.01 | 26 | 26.03 | | 35 day SMA | 26.04 | 26.1 | 26.16 | | 50 day SMA | 25.94 | 25.89 | 25.84 | | 100 day SMA | 25.13 | 25.08 | 25.06 | | 150 day SMA | 23.88 | 23.87 | 23.85 | | 200 day SMA | 24.86 | 24.87 | 24.88 |
|
|
