HuntsmanCorporation HUN full analysis,charts,indicators,moving averages,SMA,DMA,EMA,ADX,MACD,RSIHuntsman Corporation HUN WideScreen charts, DMA,SMA,EMA technical analysis, forecast prediction, by indicators ADX,MACD,RSI,CCI NYSE stock exchange
operates under Basic Industries sector & deals in Major Chemicals
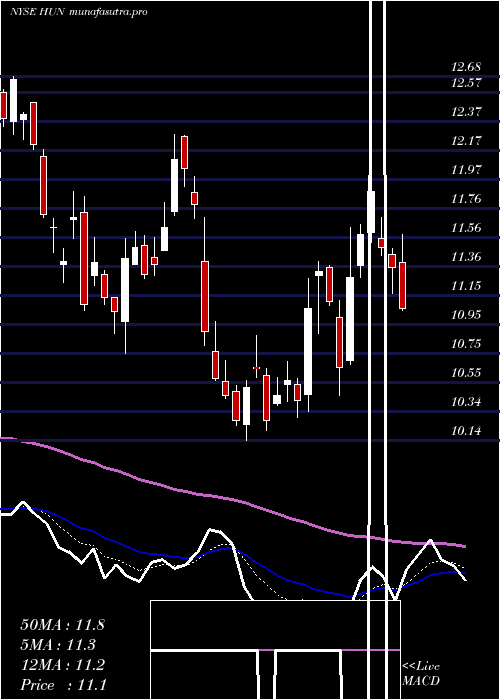
Daily price and charts and targets HuntsmanCorporation Strong Daily Stock price targets for HuntsmanCorporation HUN are 9.98 and 10.6 | Daily Target 1 | 9.54 | | Daily Target 2 | 9.79 | | Daily Target 3 | 10.16 | | Daily Target 4 | 10.41 | | Daily Target 5 | 10.78 |
Daily price and volume Huntsman Corporation
| Date |
Closing |
Open |
Range |
Volume |
Fri 05 December 2025 |
10.04 (0.3%) |
9.97 |
9.91 - 10.53 |
0.5828 times |
Thu 04 December 2025 |
10.01 (-5.66%) |
10.42 |
9.81 - 10.60 |
1.1686 times |
Wed 03 December 2025 |
10.61 (2.41%) |
10.35 |
10.35 - 10.69 |
1.0211 times |
Tue 02 December 2025 |
10.36 (-0.77%) |
10.21 |
10.04 - 10.56 |
0.976 times |
Mon 01 December 2025 |
10.44 (0.19%) |
10.30 |
10.26 - 10.59 |
0.9242 times |
Fri 28 November 2025 |
10.42 (3.37%) |
10.20 |
10.10 - 10.42 |
0.7031 times |
Wed 26 November 2025 |
10.08 (5.44%) |
9.56 |
9.55 - 10.16 |
1.4252 times |
Tue 25 November 2025 |
9.56 (8.27%) |
8.99 |
8.96 - 9.59 |
1.1173 times |
Mon 24 November 2025 |
8.83 (3.64%) |
8.67 |
8.35 - 8.85 |
1.1041 times |
Fri 21 November 2025 |
8.52 (4.41%) |
8.19 |
8.16 - 8.82 |
0.9776 times |
Thu 20 November 2025 |
8.16 (-2.97%) |
8.42 |
8.15 - 8.57 |
0.6995 times |
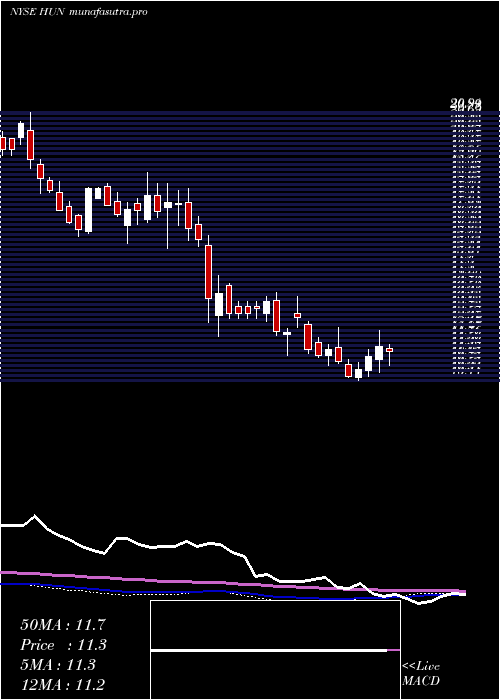
Weekly price and charts HuntsmanCorporation Strong weekly Stock price targets for HuntsmanCorporation HUN are 9.49 and 10.37 | Weekly Target 1 | 9.3 | | Weekly Target 2 | 9.67 | | Weekly Target 3 | 10.18 | | Weekly Target 4 | 10.55 | | Weekly Target 5 | 11.06 |
Weekly price and volumes for Huntsman Corporation
| Date |
Closing |
Open |
Range |
Volume |
Fri 05 December 2025 |
10.04 (-3.65%) |
10.30 |
9.81 - 10.69 |
1.1788 times |
Fri 28 November 2025 |
10.42 (22.3%) |
8.67 |
8.35 - 10.42 |
1.0973 times |
Fri 21 November 2025 |
8.52 (-2.07%) |
8.62 |
8.04 - 8.82 |
0.9553 times |
Fri 14 November 2025 |
8.70 (6.36%) |
8.35 |
8.02 - 8.97 |
1.2646 times |
Fri 07 November 2025 |
8.18 (-1.21%) |
8.02 |
7.30 - 8.57 |
1.5949 times |
Fri 31 October 2025 |
8.28 (0%) |
8.18 |
8.08 - 8.39 |
0.2064 times |
Fri 31 October 2025 |
8.28 (-8.51%) |
9.12 |
8.07 - 9.48 |
1.1124 times |
Fri 24 October 2025 |
9.05 (10.1%) |
8.29 |
8.01 - 9.06 |
0.8886 times |
Fri 17 October 2025 |
8.22 (-9.17%) |
8.31 |
7.75 - 8.54 |
1.3185 times |
Tue 07 October 2025 |
9.05 (-2.16%) |
9.35 |
9.03 - 9.71 |
0.3832 times |
Fri 03 October 2025 |
9.25 (3.01%) |
9.11 |
8.68 - 9.43 |
1.0014 times |
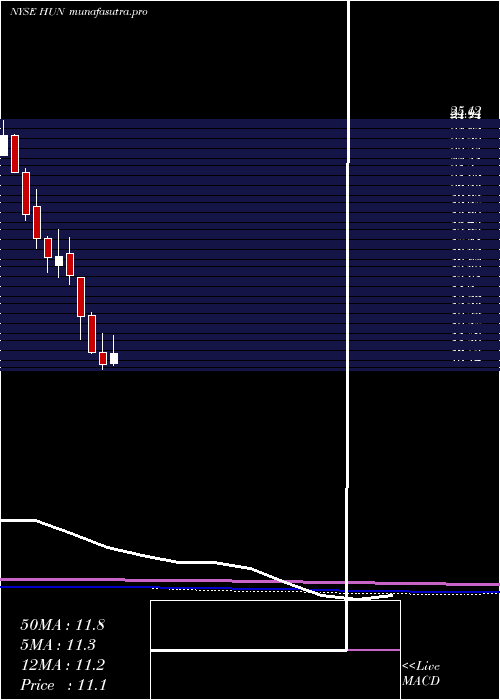
Monthly price and charts HuntsmanCorporation Strong monthly Stock price targets for HuntsmanCorporation HUN are 9.49 and 10.37 | Monthly Target 1 | 9.3 | | Monthly Target 2 | 9.67 | | Monthly Target 3 | 10.18 | | Monthly Target 4 | 10.55 | | Monthly Target 5 | 11.06 |
Monthly price and volumes Huntsman Corporation
| Date |
Closing |
Open |
Range |
Volume |
Fri 05 December 2025 |
10.04 (-3.65%) |
10.30 |
9.81 - 10.69 |
0.3132 times |
Fri 28 November 2025 |
10.42 (25.85%) |
8.02 |
7.30 - 10.42 |
1.3053 times |
Fri 31 October 2025 |
8.28 (-7.8%) |
8.97 |
7.75 - 9.71 |
1.18 times |
Tue 30 September 2025 |
8.98 (-19.53%) |
10.99 |
8.68 - 11.73 |
1.2009 times |
Fri 29 August 2025 |
11.16 (15.05%) |
9.81 |
8.91 - 11.24 |
1.139 times |
Thu 31 July 2025 |
9.70 (-6.91%) |
10.46 |
9.45 - 12.33 |
1.268 times |
Mon 30 June 2025 |
10.42 (-6.46%) |
11.14 |
10.14 - 12.28 |
0.7917 times |
Fri 30 May 2025 |
11.14 (-16.3%) |
13.37 |
11.05 - 13.55 |
1.0636 times |
Wed 30 April 2025 |
13.31 (-15.71%) |
15.64 |
11.90 - 15.66 |
0.9285 times |
Mon 31 March 2025 |
15.79 (-6.73%) |
17.11 |
15.22 - 18.08 |
0.8098 times |
Fri 28 February 2025 |
16.93 (0.59%) |
16.38 |
15.67 - 18.53 |
0.7549 times |
DMA SMA EMA moving averages of Huntsman Corporation HUN
DMA (daily moving average) of Huntsman Corporation HUN
| DMA period | DMA value | | 5 day DMA | 10.29 | | 12 day DMA | 9.62 | | 20 day DMA | 9.15 | | 35 day DMA | 8.81 | | 50 day DMA | 8.84 | | 100 day DMA | 9.71 | | 150 day DMA | 10.33 | | 200 day DMA | 11.63 | EMA (exponential moving average) of Huntsman Corporation HUN
| EMA period | EMA current | EMA prev | EMA prev2 | | 5 day EMA | 10.13 | 10.17 | 10.25 | | 12 day EMA | 9.74 | 9.69 | 9.63 | | 20 day EMA | 9.42 | 9.36 | 9.29 | | 35 day EMA | 9.23 | 9.18 | 9.13 | | 50 day EMA | 9.1 | 9.06 | 9.02 |
SMA (simple moving average) of Huntsman Corporation HUN
| SMA period | SMA current | SMA prev | SMA prev2 | | 5 day SMA | 10.29 | 10.37 | 10.38 | | 12 day SMA | 9.62 | 9.47 | 9.33 | | 20 day SMA | 9.15 | 9.02 | 8.9 | | 35 day SMA | 8.81 | 8.76 | 8.71 | | 50 day SMA | 8.84 | 8.84 | 8.83 | | 100 day SMA | 9.71 | 9.73 | 9.75 | | 150 day SMA | 10.33 | 10.36 | 10.38 | | 200 day SMA | 11.63 | 11.66 | 11.69 |
|
|
