HumanaInc HUM full analysis,charts,indicators,moving averages,SMA,DMA,EMA,ADX,MACD,RSIHumana Inc HUM WideScreen charts, DMA,SMA,EMA technical analysis, forecast prediction, by indicators ADX,MACD,RSI,CCI NYSE stock exchange
operates under Health Care sector & deals in Medical Specialities
Daily price and charts and targets HumanaInc Strong Daily Stock price targets for HumanaInc HUM are 279.83 and 288.22 | Daily Target 1 | 272.84 | | Daily Target 2 | 278.42 | | Daily Target 3 | 281.23 | | Daily Target 4 | 286.81 | | Daily Target 5 | 289.62 |
Daily price and volume Humana Inc
| Date |
Closing |
Open |
Range |
Volume |
Mon 20 October 2025 |
284.00 (3.22%) |
275.65 |
275.65 - 284.04 |
0.6805 times |
Fri 17 October 2025 |
275.13 (2.94%) |
262.05 |
261.00 - 279.14 |
0.8994 times |
Thu 16 October 2025 |
267.28 (1.95%) |
262.17 |
261.20 - 267.38 |
0.9659 times |
Wed 15 October 2025 |
262.17 (0.21%) |
260.60 |
256.69 - 262.51 |
0.9036 times |
Tue 14 October 2025 |
261.61 (-3.46%) |
266.11 |
257.94 - 268.00 |
1.7435 times |
Mon 13 October 2025 |
271.00 (-3.29%) |
280.24 |
270.35 - 281.00 |
1.0618 times |
Fri 10 October 2025 |
280.22 (-3.57%) |
285.97 |
275.93 - 285.99 |
1.0228 times |
Thu 09 October 2025 |
290.60 (-2.5%) |
301.02 |
290.06 - 301.02 |
0.6022 times |
Wed 08 October 2025 |
298.04 (0.94%) |
295.67 |
293.43 - 302.79 |
0.9853 times |
Tue 07 October 2025 |
295.25 (0.02%) |
298.29 |
290.79 - 298.75 |
1.1351 times |
Mon 06 October 2025 |
295.20 (4.43%) |
283.20 |
283.00 - 296.25 |
1.0729 times |
Weekly price and charts HumanaInc Strong weekly Stock price targets for HumanaInc HUM are 279.83 and 288.22 | Weekly Target 1 | 272.84 | | Weekly Target 2 | 278.42 | | Weekly Target 3 | 281.23 | | Weekly Target 4 | 286.81 | | Weekly Target 5 | 289.62 |
Weekly price and volumes for Humana Inc
| Date |
Closing |
Open |
Range |
Volume |
Mon 20 October 2025 |
284.00 (3.22%) |
275.65 |
275.65 - 284.04 |
0.1407 times |
Fri 17 October 2025 |
275.13 (-1.82%) |
280.24 |
256.69 - 281.00 |
1.1528 times |
Fri 10 October 2025 |
280.22 (-0.87%) |
283.20 |
275.93 - 302.79 |
0.9965 times |
Fri 03 October 2025 |
282.67 (10.87%) |
255.38 |
239.00 - 287.51 |
1.5935 times |
Fri 26 September 2025 |
254.95 (0.91%) |
250.80 |
248.50 - 263.40 |
1.126 times |
Fri 19 September 2025 |
252.66 (-8.6%) |
275.30 |
250.24 - 276.90 |
1.5392 times |
Fri 12 September 2025 |
276.44 (-10.22%) |
309.90 |
254.00 - 314.54 |
1.773 times |
Fri 05 September 2025 |
307.92 (1.4%) |
304.59 |
303.01 - 315.35 |
0.8971 times |
Fri 29 August 2025 |
303.66 (0%) |
297.56 |
297.00 - 304.07 |
0.1445 times |
Fri 29 August 2025 |
303.66 (1.39%) |
299.59 |
294.30 - 304.07 |
0.6367 times |
Fri 22 August 2025 |
299.51 (4.58%) |
289.36 |
285.21 - 301.62 |
0.9445 times |
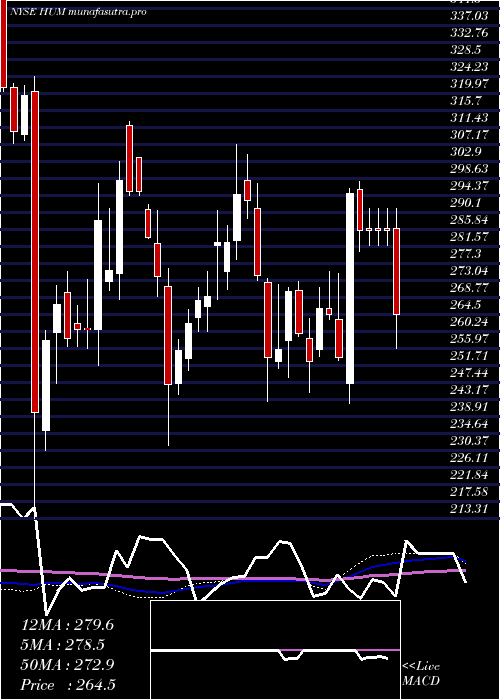
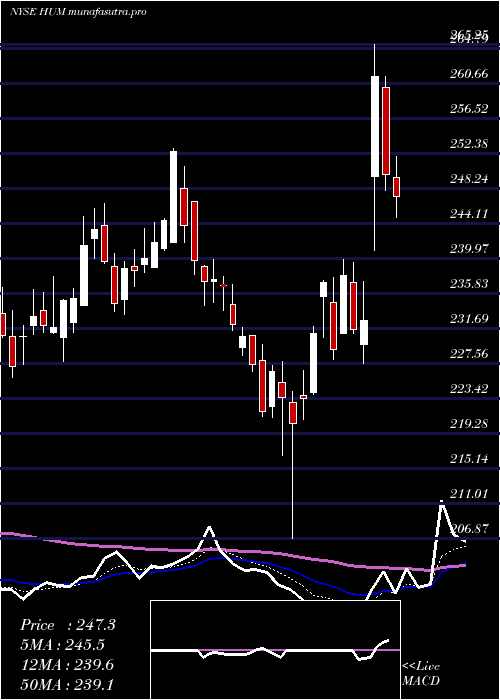
Monthly price and charts HumanaInc Strong monthly Stock price targets for HumanaInc HUM are 261.5 and 325.29 | Monthly Target 1 | 211.47 | | Monthly Target 2 | 247.74 | | Monthly Target 3 | 275.26333333333 | | Monthly Target 4 | 311.53 | | Monthly Target 5 | 339.05 |
Monthly price and volumes Humana Inc
| Date |
Closing |
Open |
Range |
Volume |
Mon 20 October 2025 |
284.00 (9.16%) |
259.96 |
239.00 - 302.79 |
0.7731 times |
Tue 30 September 2025 |
260.17 (-14.32%) |
304.59 |
248.50 - 315.35 |
1.2532 times |
Fri 29 August 2025 |
303.66 (21.53%) |
249.51 |
244.10 - 304.07 |
0.8334 times |
Thu 31 July 2025 |
249.87 (2.2%) |
241.82 |
206.87 - 265.25 |
1.2152 times |
Mon 30 June 2025 |
244.48 (4.87%) |
232.32 |
225.85 - 246.40 |
0.8877 times |
Fri 30 May 2025 |
233.13 (-11.1%) |
264.19 |
212.45 - 267.01 |
1.175 times |
Wed 30 April 2025 |
262.24 (-0.89%) |
265.08 |
242.22 - 298.00 |
1.1213 times |
Mon 31 March 2025 |
264.60 (-2.15%) |
270.72 |
245.00 - 275.35 |
0.7385 times |
Fri 28 February 2025 |
270.42 (-7.78%) |
291.23 |
242.75 - 297.56 |
1.0484 times |
Fri 31 January 2025 |
293.23 (15.58%) |
256.95 |
251.70 - 307.28 |
0.954 times |
Tue 31 December 2024 |
253.71 (-14.17%) |
290.97 |
231.65 - 292.20 |
0.8987 times |

DMA SMA EMA moving averages of Humana Inc HUM
DMA (daily moving average) of Humana Inc HUM
| DMA period | DMA value | | 5 day DMA | 270.04 | | 12 day DMA | 280.26 | | 20 day DMA | 270.64 | | 35 day DMA | 275.98 | | 50 day DMA | 280.84 | | 100 day DMA | 259.29 | | 150 day DMA | 259.98 | | 200 day DMA | 262.87 | EMA (exponential moving average) of Humana Inc HUM
| EMA period | EMA current | EMA prev | EMA prev2 | | 5 day EMA | 275.49 | 271.23 | 269.28 | | 12 day EMA | 274.47 | 272.74 | 272.31 | | 20 day EMA | 274.15 | 273.11 | 272.9 | | 35 day EMA | 276.16 | 275.7 | 275.73 | | 50 day EMA | 278.16 | 277.92 | 278.03 |
SMA (simple moving average) of Humana Inc HUM
| SMA period | SMA current | SMA prev | SMA prev2 | | 5 day SMA | 270.04 | 267.44 | 268.46 | | 12 day SMA | 280.26 | 278.08 | 275.72 | | 20 day SMA | 270.64 | 269.33 | 268.21 | | 35 day SMA | 275.98 | 276.55 | 277.36 | | 50 day SMA | 280.84 | 280.49 | 280.33 | | 100 day SMA | 259.29 | 258.71 | 258.21 | | 150 day SMA | 259.98 | 259.85 | 259.7 | | 200 day SMA | 262.87 | 262.76 | 262.65 |
|
|
