HerculesCapital HTGC full analysis,charts,indicators,moving averages,SMA,DMA,EMA,ADX,MACD,RSIHercules Capital HTGC WideScreen charts, DMA,SMA,EMA technical analysis, forecast prediction, by indicators ADX,MACD,RSI,CCI NYSE stock exchange
operates under N A sector & deals in N A
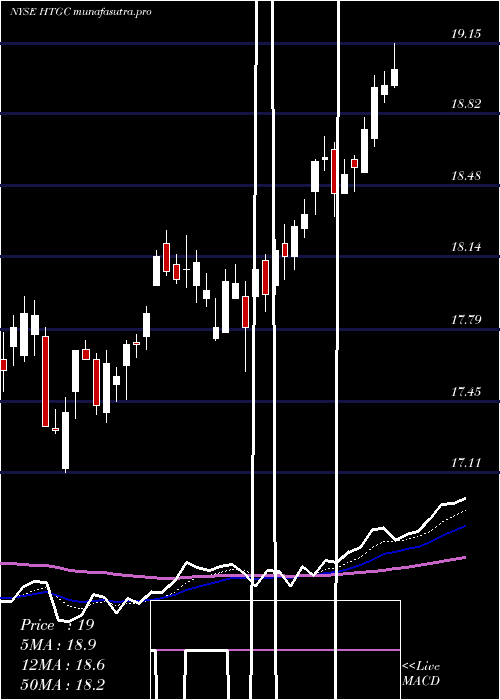
Daily price and charts and targets HerculesCapital Strong Daily Stock price targets for HerculesCapital HTGC are 18.84 and 19.07 | Daily Target 1 | 18.65 | | Daily Target 2 | 18.79 | | Daily Target 3 | 18.876666666667 | | Daily Target 4 | 19.02 | | Daily Target 5 | 19.11 |
Daily price and volume Hercules Capital
| Date |
Closing |
Open |
Range |
Volume |
Thu 04 December 2025 |
18.94 (0.96%) |
18.76 |
18.73 - 18.96 |
1.0349 times |
Wed 03 December 2025 |
18.76 (2.12%) |
18.42 |
18.42 - 18.78 |
1.2265 times |
Tue 02 December 2025 |
18.37 (1.6%) |
18.10 |
18.03 - 18.39 |
1.5072 times |
Mon 01 December 2025 |
18.08 (0.44%) |
17.86 |
17.86 - 18.15 |
1.1281 times |
Fri 28 November 2025 |
18.00 (0.67%) |
17.89 |
17.89 - 18.03 |
0.5011 times |
Wed 26 November 2025 |
17.88 (1.19%) |
17.68 |
17.68 - 17.92 |
0.8331 times |
Tue 25 November 2025 |
17.67 (0.8%) |
17.41 |
17.41 - 17.70 |
0.5547 times |
Mon 24 November 2025 |
17.53 (0.29%) |
17.45 |
17.37 - 17.60 |
0.8982 times |
Fri 21 November 2025 |
17.48 (1.04%) |
17.34 |
17.24 - 17.56 |
1.045 times |
Thu 20 November 2025 |
17.30 (-0.69%) |
17.58 |
17.28 - 17.67 |
1.2713 times |
Wed 19 November 2025 |
17.42 (0.69%) |
17.37 |
17.37 - 17.66 |
1.7835 times |
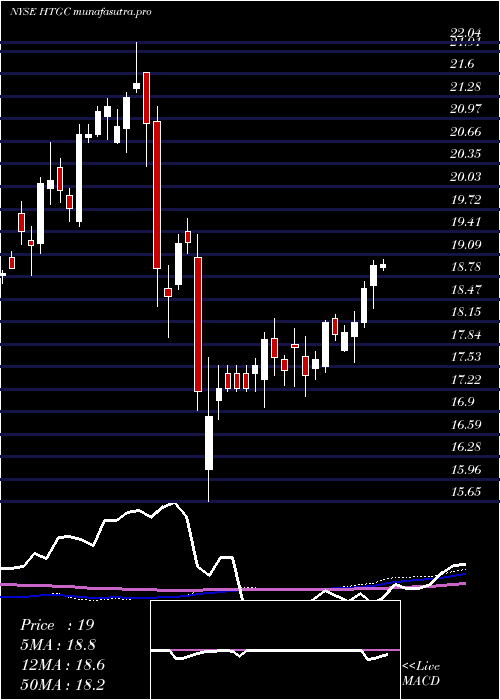
Weekly price and charts HerculesCapital Strong weekly Stock price targets for HerculesCapital HTGC are 18.4 and 19.5 | Weekly Target 1 | 17.49 | | Weekly Target 2 | 18.21 | | Weekly Target 3 | 18.586666666667 | | Weekly Target 4 | 19.31 | | Weekly Target 5 | 19.69 |
Weekly price and volumes for Hercules Capital
| Date |
Closing |
Open |
Range |
Volume |
Thu 04 December 2025 |
18.94 (5.22%) |
17.86 |
17.86 - 18.96 |
0.9806 times |
Fri 28 November 2025 |
18.00 (2.97%) |
17.45 |
17.37 - 18.03 |
0.5581 times |
Fri 21 November 2025 |
17.48 (-0.51%) |
17.52 |
16.97 - 17.67 |
1.3274 times |
Fri 14 November 2025 |
17.57 (-2.39%) |
18.07 |
17.42 - 18.08 |
1.2181 times |
Fri 07 November 2025 |
18.00 (0.45%) |
17.87 |
17.66 - 18.11 |
0.866 times |
Fri 31 October 2025 |
17.92 (0%) |
17.50 |
17.40 - 18.05 |
0.2851 times |
Fri 31 October 2025 |
17.92 (1.7%) |
17.72 |
17.40 - 18.12 |
1.0872 times |
Fri 24 October 2025 |
17.62 (2.03%) |
17.40 |
17.31 - 17.82 |
0.8195 times |
Fri 17 October 2025 |
17.27 (3.41%) |
16.83 |
16.75 - 17.60 |
1.0732 times |
Fri 10 October 2025 |
16.70 (-9.24%) |
18.46 |
16.63 - 18.56 |
1.7848 times |
Fri 03 October 2025 |
18.40 (-3.72%) |
19.17 |
18.40 - 19.17 |
0.7553 times |
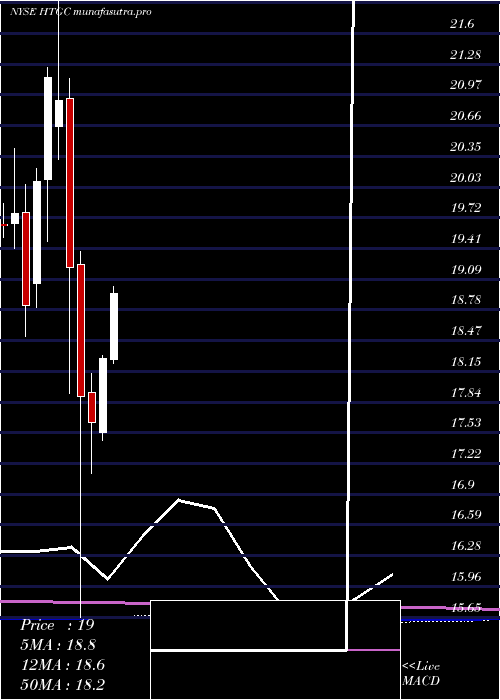
Monthly price and charts HerculesCapital Strong monthly Stock price targets for HerculesCapital HTGC are 18.4 and 19.5 | Monthly Target 1 | 17.49 | | Monthly Target 2 | 18.21 | | Monthly Target 3 | 18.586666666667 | | Monthly Target 4 | 19.31 | | Monthly Target 5 | 19.69 |
Monthly price and volumes Hercules Capital
| Date |
Closing |
Open |
Range |
Volume |
Thu 04 December 2025 |
18.94 (5.22%) |
17.86 |
17.86 - 18.96 |
0.2466 times |
Fri 28 November 2025 |
18.00 (0.45%) |
17.87 |
16.97 - 18.11 |
0.9984 times |
Fri 31 October 2025 |
17.92 (-5.24%) |
18.91 |
16.63 - 18.91 |
1.3859 times |
Tue 30 September 2025 |
18.91 (-3.13%) |
19.40 |
18.77 - 19.62 |
0.7999 times |
Fri 29 August 2025 |
19.52 (4.05%) |
19.00 |
18.75 - 19.67 |
0.9284 times |
Thu 31 July 2025 |
18.76 (2.63%) |
18.27 |
18.23 - 19.65 |
0.9524 times |
Mon 30 June 2025 |
18.28 (3.69%) |
17.53 |
17.45 - 18.31 |
0.7457 times |
Fri 30 May 2025 |
17.63 (-1.51%) |
17.94 |
17.11 - 18.13 |
1.3847 times |
Wed 30 April 2025 |
17.90 (-6.82%) |
19.24 |
15.65 - 19.37 |
1.1748 times |
Mon 31 March 2025 |
19.21 (-8.13%) |
20.93 |
17.93 - 21.14 |
1.3832 times |
Fri 28 February 2025 |
20.91 (-1.13%) |
20.65 |
20.31 - 22.04 |
0.8258 times |
DMA SMA EMA moving averages of Hercules Capital HTGC
DMA (daily moving average) of Hercules Capital HTGC
| DMA period | DMA value | | 5 day DMA | 18.43 | | 12 day DMA | 17.89 | | 20 day DMA | 17.82 | | 35 day DMA | 17.78 | | 50 day DMA | 17.87 | | 100 day DMA | 18.58 | | 150 day DMA | 18.37 | | 200 day DMA | 18.42 | EMA (exponential moving average) of Hercules Capital HTGC
| EMA period | EMA current | EMA prev | EMA prev2 | | 5 day EMA | 18.5 | 18.28 | 18.04 | | 12 day EMA | 18.12 | 17.97 | 17.83 | | 20 day EMA | 17.98 | 17.88 | 17.79 | | 35 day EMA | 17.97 | 17.91 | 17.86 | | 50 day EMA | 18.05 | 18.01 | 17.98 |
SMA (simple moving average) of Hercules Capital HTGC
| SMA period | SMA current | SMA prev | SMA prev2 | | 5 day SMA | 18.43 | 18.22 | 18 | | 12 day SMA | 17.89 | 17.74 | 17.64 | | 20 day SMA | 17.82 | 17.78 | 17.74 | | 35 day SMA | 17.78 | 17.73 | 17.69 | | 50 day SMA | 17.87 | 17.87 | 17.88 | | 100 day SMA | 18.58 | 18.58 | 18.58 | | 150 day SMA | 18.37 | 18.36 | 18.36 | | 200 day SMA | 18.42 | 18.44 | 18.45 |
|
|
