HpInc HPQ full analysis,charts,indicators,moving averages,SMA,DMA,EMA,ADX,MACD,RSIHp Inc HPQ WideScreen charts, DMA,SMA,EMA technical analysis, forecast prediction, by indicators ADX,MACD,RSI,CCI NYSE stock exchange
operates under Technology sector & deals in Computer Manufacturing
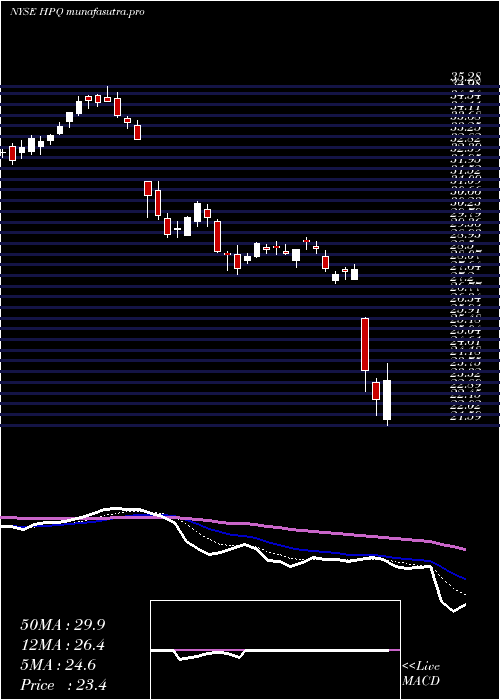
Daily price and charts and targets HpInc Strong Daily Stock price targets for HpInc HPQ are 25.58 and 25.98 | Daily Target 1 | 25.46 | | Daily Target 2 | 25.69 | | Daily Target 3 | 25.863333333333 | | Daily Target 4 | 26.09 | | Daily Target 5 | 26.26 |
Daily price and volume Hp Inc
| Date |
Closing |
Open |
Range |
Volume |
Fri 05 December 2025 |
25.91 (0.04%) |
25.93 |
25.64 - 26.04 |
0.7866 times |
Thu 04 December 2025 |
25.90 (2.82%) |
25.19 |
25.11 - 25.93 |
0.8974 times |
Wed 03 December 2025 |
25.19 (0.16%) |
25.24 |
24.97 - 25.47 |
0.9209 times |
Tue 02 December 2025 |
25.15 (3.12%) |
24.75 |
24.43 - 25.45 |
1.1963 times |
Mon 01 December 2025 |
24.39 (-0.12%) |
24.00 |
23.98 - 24.72 |
1.091 times |
Fri 28 November 2025 |
24.42 (1.83%) |
24.15 |
23.84 - 24.43 |
0.5287 times |
Wed 26 November 2025 |
23.98 (-1.32%) |
23.19 |
22.87 - 24.58 |
1.1899 times |
Tue 25 November 2025 |
24.30 (-0.41%) |
24.34 |
24.20 - 25.05 |
1.1606 times |
Mon 24 November 2025 |
24.40 (1.84%) |
23.98 |
23.95 - 24.50 |
0.7402 times |
Fri 21 November 2025 |
23.96 (5.97%) |
22.80 |
22.77 - 24.26 |
1.4883 times |
Thu 20 November 2025 |
22.61 (0.62%) |
22.68 |
22.27 - 22.94 |
1.1974 times |
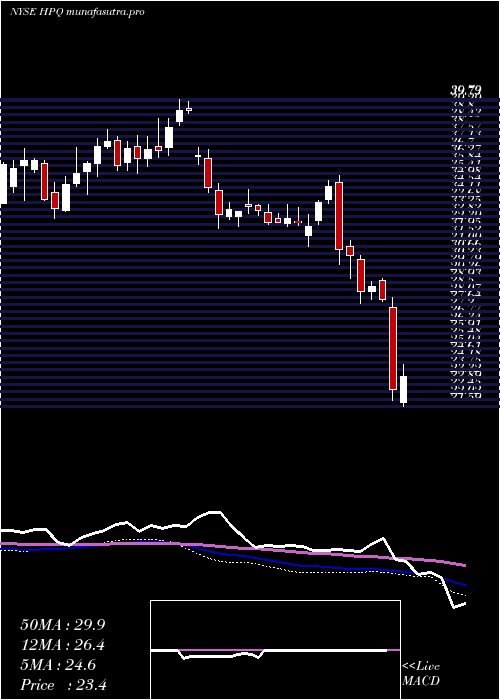
Weekly price and charts HpInc Strong weekly Stock price targets for HpInc HPQ are 24.95 and 27.01 | Weekly Target 1 | 23.25 | | Weekly Target 2 | 24.58 | | Weekly Target 3 | 25.31 | | Weekly Target 4 | 26.64 | | Weekly Target 5 | 27.37 |
Weekly price and volumes for Hp Inc
| Date |
Closing |
Open |
Range |
Volume |
Fri 05 December 2025 |
25.91 (6.1%) |
24.00 |
23.98 - 26.04 |
1.28 times |
Fri 28 November 2025 |
24.42 (1.92%) |
23.98 |
22.87 - 25.05 |
0.947 times |
Fri 21 November 2025 |
23.96 (-2.32%) |
23.56 |
22.27 - 24.26 |
1.4473 times |
Fri 14 November 2025 |
24.53 (-6.66%) |
26.57 |
24.47 - 26.58 |
1.1919 times |
Fri 07 November 2025 |
26.28 (-5.02%) |
26.52 |
25.76 - 26.72 |
0.714 times |
Fri 31 October 2025 |
27.67 (0%) |
27.52 |
27.29 - 27.88 |
0.2872 times |
Fri 31 October 2025 |
27.67 (0.04%) |
27.94 |
27.18 - 28.25 |
1.0435 times |
Fri 24 October 2025 |
27.66 (1.06%) |
27.56 |
26.97 - 28.50 |
0.8565 times |
Fri 17 October 2025 |
27.37 (3.09%) |
26.03 |
26.01 - 28.99 |
1.8065 times |
Tue 07 October 2025 |
26.55 (-0.52%) |
26.80 |
26.20 - 26.91 |
0.4259 times |
Fri 03 October 2025 |
26.69 (-0.07%) |
26.89 |
26.40 - 27.29 |
0.9864 times |
Monthly price and charts HpInc Strong monthly Stock price targets for HpInc HPQ are 24.95 and 27.01 | Monthly Target 1 | 23.25 | | Monthly Target 2 | 24.58 | | Monthly Target 3 | 25.31 | | Monthly Target 4 | 26.64 | | Monthly Target 5 | 27.37 |
Monthly price and volumes Hp Inc
| Date |
Closing |
Open |
Range |
Volume |
Fri 05 December 2025 |
25.91 (6.1%) |
24.00 |
23.98 - 26.04 |
0.3494 times |
Fri 28 November 2025 |
24.42 (-11.75%) |
26.52 |
22.27 - 26.72 |
1.1738 times |
Fri 31 October 2025 |
27.67 (1.62%) |
27.19 |
26.01 - 28.99 |
1.3818 times |
Tue 30 September 2025 |
27.23 (-4.59%) |
28.05 |
26.32 - 29.55 |
1.0619 times |
Fri 29 August 2025 |
28.54 (15.08%) |
24.52 |
24.10 - 28.92 |
1.0324 times |
Thu 31 July 2025 |
24.80 (1.39%) |
24.31 |
24.11 - 26.27 |
0.8921 times |
Mon 30 June 2025 |
24.46 (-1.77%) |
24.94 |
23.46 - 25.71 |
1.0248 times |
Fri 30 May 2025 |
24.90 (-2.62%) |
25.67 |
23.59 - 29.48 |
1.0293 times |
Wed 30 April 2025 |
25.57 (-7.66%) |
27.88 |
21.21 - 28.07 |
1.1569 times |
Mon 31 March 2025 |
27.69 (-10.3%) |
31.08 |
27.30 - 31.43 |
0.8977 times |
Fri 28 February 2025 |
30.87 (-5.02%) |
31.71 |
29.98 - 35.28 |
0.72 times |
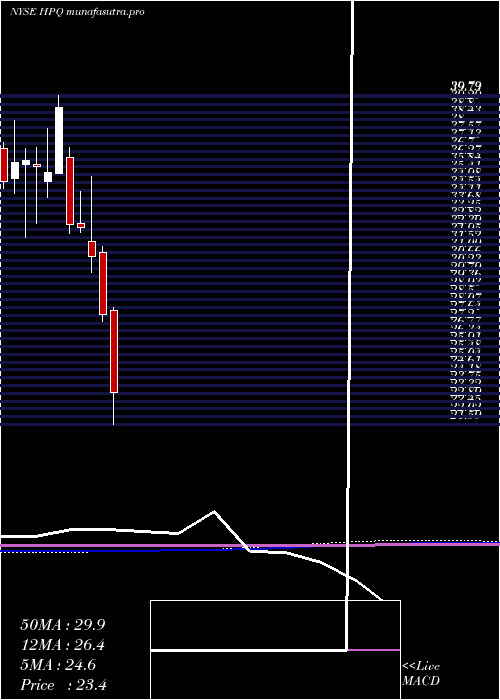
DMA SMA EMA moving averages of Hp Inc HPQ
DMA (daily moving average) of Hp Inc HPQ
| DMA period | DMA value | | 5 day DMA | 25.31 | | 12 day DMA | 24.39 | | 20 day DMA | 24.46 | | 35 day DMA | 25.74 | | 50 day DMA | 26.19 | | 100 day DMA | 26.5 | | 150 day DMA | 26.32 | | 200 day DMA | 26.72 | EMA (exponential moving average) of Hp Inc HPQ
| EMA period | EMA current | EMA prev | EMA prev2 | | 5 day EMA | 25.39 | 25.13 | 24.74 | | 12 day EMA | 24.92 | 24.74 | 24.53 | | 20 day EMA | 25 | 24.9 | 24.8 | | 35 day EMA | 25.47 | 25.44 | 25.41 | | 50 day EMA | 26.26 | 26.27 | 26.29 |
SMA (simple moving average) of Hp Inc HPQ
| SMA period | SMA current | SMA prev | SMA prev2 | | 5 day SMA | 25.31 | 25.01 | 24.63 | | 12 day SMA | 24.39 | 24.12 | 23.87 | | 20 day SMA | 24.46 | 24.48 | 24.51 | | 35 day SMA | 25.74 | 25.78 | 25.85 | | 50 day SMA | 26.19 | 26.23 | 26.28 | | 100 day SMA | 26.5 | 26.49 | 26.49 | | 150 day SMA | 26.32 | 26.32 | 26.32 | | 200 day SMA | 26.72 | 26.76 | 26.79 |
|
|
