JohnHancock HPF full analysis,charts,indicators,moving averages,SMA,DMA,EMA,ADX,MACD,RSIJohn Hancock HPF WideScreen charts, DMA,SMA,EMA technical analysis, forecast prediction, by indicators ADX,MACD,RSI,CCI NYSE stock exchange
operates under N A sector & deals in N A
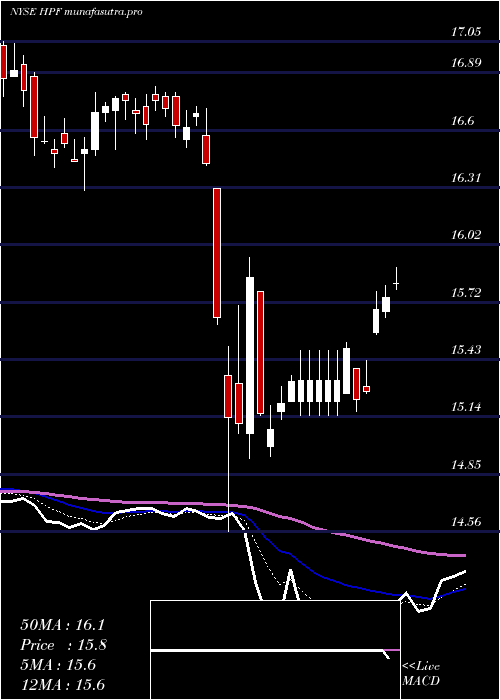
Daily price and charts and targets JohnHancock Strong Daily Stock price targets for JohnHancock HPF are 16.32 and 16.41 | Daily Target 1 | 16.25 | | Daily Target 2 | 16.3 | | Daily Target 3 | 16.343333333333 | | Daily Target 4 | 16.39 | | Daily Target 5 | 16.43 |
Daily price and volume John Hancock
| Date |
Closing |
Open |
Range |
Volume |
Fri 05 December 2025 |
16.34 (0.12%) |
16.30 |
16.30 - 16.39 |
0.6966 times |
Thu 04 December 2025 |
16.32 (-0.12%) |
16.35 |
16.32 - 16.39 |
0.8277 times |
Wed 03 December 2025 |
16.34 (-0.12%) |
16.32 |
16.31 - 16.39 |
1.1192 times |
Tue 02 December 2025 |
16.36 (0.18%) |
16.40 |
16.30 - 16.40 |
0.9793 times |
Mon 01 December 2025 |
16.33 (-0.61%) |
16.42 |
16.20 - 16.46 |
1.3203 times |
Fri 28 November 2025 |
16.43 (0.37%) |
16.44 |
16.33 - 16.47 |
0.8802 times |
Wed 26 November 2025 |
16.37 (0.49%) |
16.23 |
16.23 - 16.41 |
1.1979 times |
Tue 25 November 2025 |
16.29 (0.62%) |
16.24 |
16.22 - 16.29 |
0.3556 times |
Mon 24 November 2025 |
16.19 (0.56%) |
16.11 |
16.11 - 16.23 |
1.3786 times |
Fri 21 November 2025 |
16.10 (-0.37%) |
16.03 |
15.95 - 16.19 |
1.2445 times |
Thu 20 November 2025 |
16.16 (-0.86%) |
16.35 |
16.00 - 16.35 |
1.6322 times |
Weekly price and charts JohnHancock Strong weekly Stock price targets for JohnHancock HPF are 16.14 and 16.4 | Weekly Target 1 | 16.07 | | Weekly Target 2 | 16.21 | | Weekly Target 3 | 16.333333333333 | | Weekly Target 4 | 16.47 | | Weekly Target 5 | 16.59 |
Weekly price and volumes for John Hancock
| Date |
Closing |
Open |
Range |
Volume |
Fri 05 December 2025 |
16.34 (-0.55%) |
16.42 |
16.20 - 16.46 |
1.1424 times |
Fri 28 November 2025 |
16.43 (2.05%) |
16.11 |
16.11 - 16.47 |
0.881 times |
Fri 21 November 2025 |
16.10 (-1.83%) |
16.44 |
15.95 - 16.46 |
1.8328 times |
Fri 14 November 2025 |
16.40 (-1.68%) |
16.76 |
16.38 - 16.83 |
1.0555 times |
Fri 07 November 2025 |
16.68 (-0.12%) |
16.62 |
16.56 - 16.75 |
1.0791 times |
Fri 31 October 2025 |
16.70 (0%) |
16.84 |
16.64 - 16.84 |
0.2957 times |
Fri 31 October 2025 |
16.70 (0.3%) |
16.68 |
16.60 - 16.84 |
0.9891 times |
Fri 24 October 2025 |
16.65 (0.67%) |
16.54 |
16.54 - 16.75 |
1.0575 times |
Fri 17 October 2025 |
16.54 (-3.05%) |
16.78 |
16.52 - 16.83 |
0.9612 times |
Tue 07 October 2025 |
17.06 (0.41%) |
17.00 |
16.94 - 17.13 |
0.7058 times |
Fri 03 October 2025 |
16.99 (1.13%) |
16.83 |
16.77 - 17.02 |
1.6435 times |
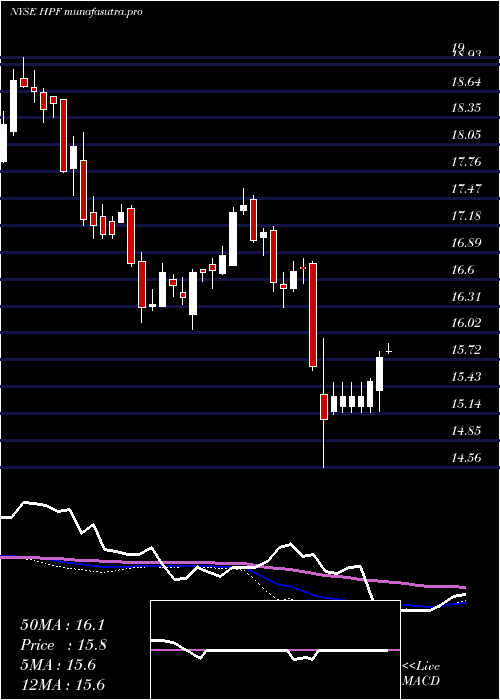
Monthly price and charts JohnHancock Strong monthly Stock price targets for JohnHancock HPF are 16.14 and 16.4 | Monthly Target 1 | 16.07 | | Monthly Target 2 | 16.21 | | Monthly Target 3 | 16.333333333333 | | Monthly Target 4 | 16.47 | | Monthly Target 5 | 16.59 |
Monthly price and volumes John Hancock
| Date |
Closing |
Open |
Range |
Volume |
Fri 05 December 2025 |
16.34 (-0.55%) |
16.42 |
16.20 - 16.46 |
0.2461 times |
Fri 28 November 2025 |
16.43 (-1.62%) |
16.62 |
15.95 - 16.83 |
1.0444 times |
Fri 31 October 2025 |
16.70 (-0.89%) |
16.80 |
16.52 - 17.13 |
1.0165 times |
Tue 30 September 2025 |
16.85 (4.27%) |
16.13 |
16.02 - 16.95 |
1.3476 times |
Fri 29 August 2025 |
16.16 (0.75%) |
16.01 |
15.92 - 16.31 |
1.0586 times |
Thu 31 July 2025 |
16.04 (1.45%) |
15.81 |
15.69 - 16.20 |
1.2091 times |
Mon 30 June 2025 |
15.81 (0.51%) |
15.75 |
15.53 - 16.01 |
1.0693 times |
Fri 30 May 2025 |
15.73 (-1.01%) |
15.90 |
15.56 - 16.41 |
0.9699 times |
Wed 30 April 2025 |
15.89 (-4.39%) |
16.55 |
14.56 - 16.72 |
1.1758 times |
Mon 31 March 2025 |
16.62 (-2.81%) |
17.13 |
16.29 - 17.17 |
0.8627 times |
Fri 28 February 2025 |
17.10 (1.42%) |
16.75 |
16.75 - 17.58 |
1.017 times |

DMA SMA EMA moving averages of John Hancock HPF
DMA (daily moving average) of John Hancock HPF
| DMA period | DMA value | | 5 day DMA | 16.34 | | 12 day DMA | 16.29 | | 20 day DMA | 16.4 | | 35 day DMA | 16.51 | | 50 day DMA | 16.61 | | 100 day DMA | 16.39 | | 150 day DMA | 16.22 | | 200 day DMA | 16.23 | EMA (exponential moving average) of John Hancock HPF
| EMA period | EMA current | EMA prev | EMA prev2 | | 5 day EMA | 16.33 | 16.33 | 16.34 | | 12 day EMA | 16.35 | 16.35 | 16.36 | | 20 day EMA | 16.39 | 16.39 | 16.4 | | 35 day EMA | 16.48 | 16.49 | 16.5 | | 50 day EMA | 16.6 | 16.61 | 16.62 |
SMA (simple moving average) of John Hancock HPF
| SMA period | SMA current | SMA prev | SMA prev2 | | 5 day SMA | 16.34 | 16.36 | 16.37 | | 12 day SMA | 16.29 | 16.29 | 16.29 | | 20 day SMA | 16.4 | 16.41 | 16.43 | | 35 day SMA | 16.51 | 16.51 | 16.52 | | 50 day SMA | 16.61 | 16.62 | 16.63 | | 100 day SMA | 16.39 | 16.38 | 16.38 | | 150 day SMA | 16.22 | 16.22 | 16.22 | | 200 day SMA | 16.23 | 16.24 | 16.24 |
|
|
