HeclaMining HL full analysis,charts,indicators,moving averages,SMA,DMA,EMA,ADX,MACD,RSIHecla Mining HL WideScreen charts, DMA,SMA,EMA technical analysis, forecast prediction, by indicators ADX,MACD,RSI,CCI NYSE stock exchange
operates under Basic Industries sector & deals in Mining Quarrying Of Nonmetallic Minerals No Fuels
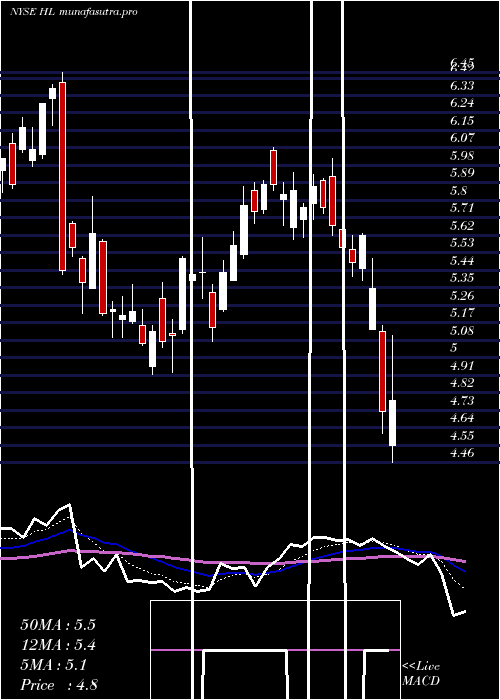
Daily price and charts and targets HeclaMining Strong Daily Stock price targets for HeclaMining HL are 16.35 and 17.12 | Daily Target 1 | 16.19 | | Daily Target 2 | 16.5 | | Daily Target 3 | 16.956666666667 | | Daily Target 4 | 17.27 | | Daily Target 5 | 17.73 |
Daily price and volume Hecla Mining
| Date |
Closing |
Open |
Range |
Volume |
Thu 04 December 2025 |
16.82 (-3.11%) |
17.36 |
16.64 - 17.41 |
0.8493 times |
Wed 03 December 2025 |
17.36 (-1.03%) |
17.65 |
17.21 - 18.12 |
0.9343 times |
Tue 02 December 2025 |
17.54 (2.57%) |
17.09 |
16.45 - 17.55 |
1.0164 times |
Mon 01 December 2025 |
17.10 (1.66%) |
17.24 |
16.55 - 17.40 |
1.5061 times |
Fri 28 November 2025 |
16.82 (5.39%) |
16.40 |
16.26 - 16.96 |
0.8673 times |
Wed 26 November 2025 |
15.96 (6.4%) |
15.50 |
15.04 - 16.21 |
0.9344 times |
Tue 25 November 2025 |
15.00 (3.66%) |
14.40 |
14.17 - 15.26 |
0.8066 times |
Mon 24 November 2025 |
14.47 (8.15%) |
13.32 |
13.32 - 14.53 |
0.6013 times |
Fri 21 November 2025 |
13.38 (1.29%) |
13.17 |
12.80 - 13.40 |
1.4486 times |
Thu 20 November 2025 |
13.21 (-6.38%) |
14.24 |
13.11 - 14.69 |
1.0355 times |
Wed 19 November 2025 |
14.11 (0.36%) |
14.41 |
13.77 - 14.85 |
0.7051 times |
Weekly price and charts HeclaMining Strong weekly Stock price targets for HeclaMining HL are 15.8 and 17.47 | Weekly Target 1 | 15.46 | | Weekly Target 2 | 16.14 | | Weekly Target 3 | 17.13 | | Weekly Target 4 | 17.81 | | Weekly Target 5 | 18.8 |
Weekly price and volumes for Hecla Mining
| Date |
Closing |
Open |
Range |
Volume |
Thu 04 December 2025 |
16.82 (0%) |
17.24 |
16.45 - 18.12 |
0.9485 times |
Fri 28 November 2025 |
16.82 (25.71%) |
13.32 |
13.32 - 16.96 |
0.707 times |
Fri 21 November 2025 |
13.38 (-8.36%) |
14.30 |
12.80 - 14.85 |
1.019 times |
Fri 14 November 2025 |
14.60 (5.19%) |
14.53 |
13.68 - 16.10 |
1.0162 times |
Fri 07 November 2025 |
13.88 (7.85%) |
12.44 |
11.81 - 15.42 |
1.0763 times |
Fri 31 October 2025 |
12.87 (0%) |
12.90 |
12.57 - 12.95 |
0.3471 times |
Fri 31 October 2025 |
12.87 (-0.69%) |
12.40 |
12.02 - 13.25 |
1.1943 times |
Fri 24 October 2025 |
12.96 (-7.76%) |
13.94 |
11.98 - 14.56 |
0.9272 times |
Fri 17 October 2025 |
14.05 (12.04%) |
13.50 |
13.09 - 15.80 |
1.4016 times |
Fri 10 October 2025 |
12.54 (5.38%) |
12.10 |
11.80 - 13.84 |
1.3629 times |
Fri 03 October 2025 |
11.90 (1.97%) |
12.00 |
11.48 - 12.55 |
1.3009 times |

Monthly price and charts HeclaMining Strong monthly Stock price targets for HeclaMining HL are 15.8 and 17.47 | Monthly Target 1 | 15.46 | | Monthly Target 2 | 16.14 | | Monthly Target 3 | 17.13 | | Monthly Target 4 | 17.81 | | Monthly Target 5 | 18.8 |
Monthly price and volumes Hecla Mining
| Date |
Closing |
Open |
Range |
Volume |
Thu 04 December 2025 |
16.82 (0%) |
17.24 |
16.45 - 18.12 |
0.1677 times |
Fri 28 November 2025 |
16.82 (30.69%) |
12.44 |
11.81 - 16.96 |
0.6751 times |
Fri 31 October 2025 |
12.87 (6.36%) |
12.22 |
11.57 - 15.80 |
1.0493 times |
Tue 30 September 2025 |
12.10 (42.19%) |
8.85 |
8.42 - 12.26 |
1.724 times |
Fri 29 August 2025 |
8.51 (48.26%) |
5.87 |
5.62 - 8.54 |
1.1179 times |
Thu 31 July 2025 |
5.74 (-4.17%) |
6.00 |
5.48 - 6.48 |
1.0727 times |
Mon 30 June 2025 |
5.99 (16.54%) |
5.28 |
5.28 - 6.90 |
1.1113 times |
Fri 30 May 2025 |
5.14 (-10.14%) |
5.56 |
4.51 - 5.60 |
1.0545 times |
Wed 30 April 2025 |
5.72 (2.88%) |
5.55 |
4.46 - 6.21 |
1.0148 times |
Mon 31 March 2025 |
5.56 (8.38%) |
5.30 |
4.92 - 6.07 |
1.0127 times |
Fri 28 February 2025 |
5.13 (-9.68%) |
5.64 |
4.91 - 6.45 |
0.9442 times |
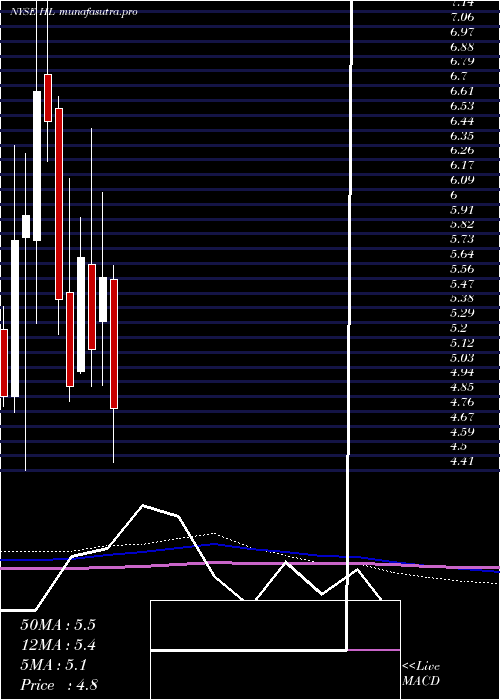
DMA SMA EMA moving averages of Hecla Mining HL
DMA (daily moving average) of Hecla Mining HL
| DMA period | DMA value | | 5 day DMA | 17.13 | | 12 day DMA | 15.49 | | 20 day DMA | 15.1 | | 35 day DMA | 14.24 | | 50 day DMA | 13.72 | | 100 day DMA | 10.95 | | 150 day DMA | 9.16 | | 200 day DMA | 8.26 | EMA (exponential moving average) of Hecla Mining HL
| EMA period | EMA current | EMA prev | EMA prev2 | | 5 day EMA | 16.82 | 16.82 | 16.55 | | 12 day EMA | 15.94 | 15.78 | 15.49 | | 20 day EMA | 15.28 | 15.12 | 14.88 | | 35 day EMA | 14.52 | 14.38 | 14.2 | | 50 day EMA | 13.84 | 13.72 | 13.57 |
SMA (simple moving average) of Hecla Mining HL
| SMA period | SMA current | SMA prev | SMA prev2 | | 5 day SMA | 17.13 | 16.96 | 16.48 | | 12 day SMA | 15.49 | 15.25 | 15.02 | | 20 day SMA | 15.1 | 14.87 | 14.6 | | 35 day SMA | 14.24 | 14.16 | 14.04 | | 50 day SMA | 13.72 | 13.6 | 13.48 | | 100 day SMA | 10.95 | 10.85 | 10.73 | | 150 day SMA | 9.16 | 9.09 | 9.01 | | 200 day SMA | 8.26 | 8.2 | 8.14 |
|
|
