HighwoodsProperties HIW full analysis,charts,indicators,moving averages,SMA,DMA,EMA,ADX,MACD,RSIHighwoods Properties HIW WideScreen charts, DMA,SMA,EMA technical analysis, forecast prediction, by indicators ADX,MACD,RSI,CCI NYSE stock exchange
operates under Consumer Services sector & deals in Real Estate Investment Trusts
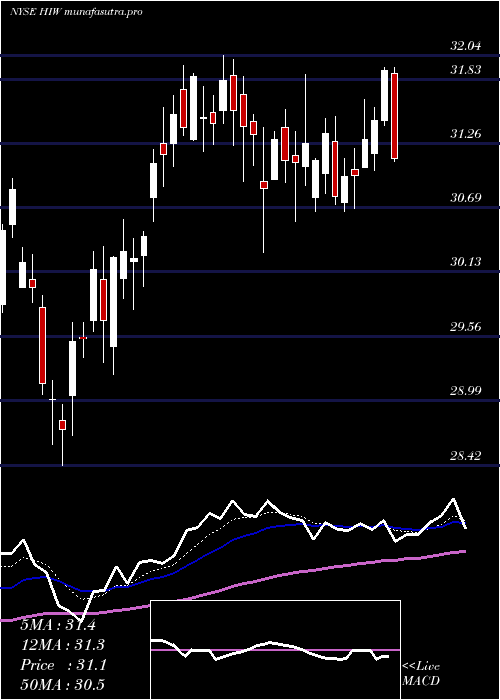
Daily price and charts and targets HighwoodsProperties Strong Daily Stock price targets for HighwoodsProperties HIW are 26.17 and 26.89 | Daily Target 1 | 26.04 | | Daily Target 2 | 26.29 | | Daily Target 3 | 26.756666666667 | | Daily Target 4 | 27.01 | | Daily Target 5 | 27.48 |
Daily price and volume Highwoods Properties
| Date |
Closing |
Open |
Range |
Volume |
Thu 04 December 2025 |
26.55 (-2.21%) |
27.06 |
26.50 - 27.22 |
1.0516 times |
Wed 03 December 2025 |
27.15 (-0.69%) |
27.33 |
26.97 - 27.62 |
0.9904 times |
Tue 02 December 2025 |
27.34 (-0.62%) |
27.69 |
27.22 - 27.70 |
0.938 times |
Mon 01 December 2025 |
27.51 (-1.04%) |
27.52 |
27.33 - 27.89 |
0.8 times |
Fri 28 November 2025 |
27.80 (-0.29%) |
27.99 |
27.70 - 27.99 |
0.3841 times |
Wed 26 November 2025 |
27.88 (1.16%) |
27.64 |
27.60 - 28.16 |
1.0806 times |
Tue 25 November 2025 |
27.56 (1.47%) |
27.31 |
27.18 - 27.87 |
1.8033 times |
Mon 24 November 2025 |
27.16 (-0.48%) |
27.26 |
27.11 - 27.42 |
0.967 times |
Fri 21 November 2025 |
27.29 (0.4%) |
27.13 |
27.02 - 27.58 |
1.1341 times |
Thu 20 November 2025 |
27.18 (-1.16%) |
27.66 |
27.17 - 27.80 |
0.8507 times |
Wed 19 November 2025 |
27.50 (-2.07%) |
28.00 |
27.34 - 28.13 |
0.7444 times |
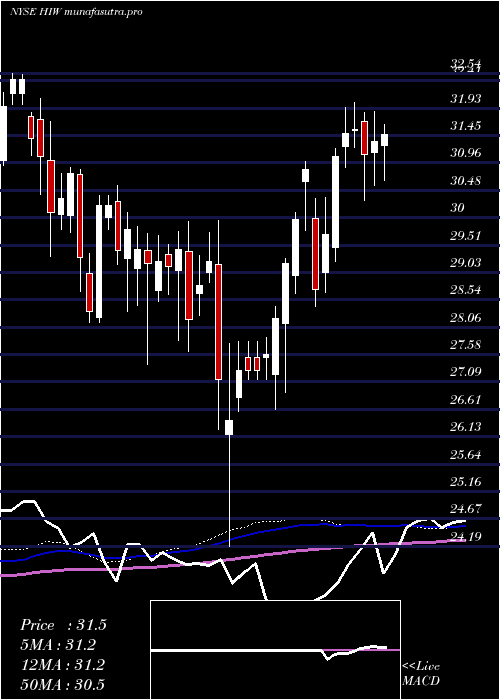
Weekly price and charts HighwoodsProperties Strong weekly Stock price targets for HighwoodsProperties HIW are 25.83 and 27.22 | Weekly Target 1 | 25.59 | | Weekly Target 2 | 26.07 | | Weekly Target 3 | 26.98 | | Weekly Target 4 | 27.46 | | Weekly Target 5 | 28.37 |
Weekly price and volumes for Highwoods Properties
| Date |
Closing |
Open |
Range |
Volume |
Thu 04 December 2025 |
26.55 (-4.5%) |
27.52 |
26.50 - 27.89 |
1.1233 times |
Fri 28 November 2025 |
27.80 (1.87%) |
27.26 |
27.11 - 28.16 |
1.2585 times |
Fri 21 November 2025 |
27.29 (-6.35%) |
28.55 |
27.02 - 28.61 |
1.1604 times |
Fri 14 November 2025 |
29.14 (-0.75%) |
29.28 |
28.70 - 29.37 |
1.1833 times |
Fri 07 November 2025 |
29.36 (2.55%) |
28.49 |
28.13 - 29.38 |
0.9226 times |
Fri 31 October 2025 |
28.63 (0%) |
28.48 |
28.24 - 28.99 |
0.4018 times |
Fri 31 October 2025 |
28.63 (-3.7%) |
29.75 |
27.98 - 29.84 |
1.645 times |
Fri 24 October 2025 |
29.73 (-1.03%) |
30.05 |
29.29 - 30.28 |
1.0287 times |
Fri 17 October 2025 |
30.04 (-5.36%) |
30.08 |
29.50 - 30.52 |
1.0469 times |
Tue 07 October 2025 |
31.74 (-2.16%) |
32.42 |
31.73 - 32.46 |
0.2297 times |
Fri 03 October 2025 |
32.44 (3.64%) |
31.24 |
31.01 - 32.76 |
1.0005 times |
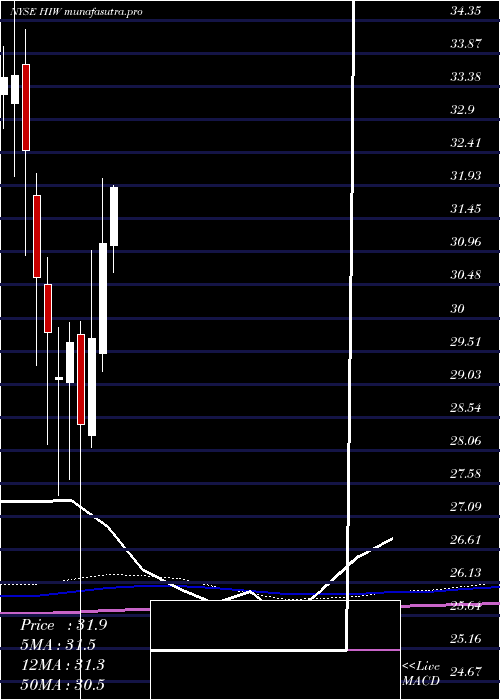
Monthly price and charts HighwoodsProperties Strong monthly Stock price targets for HighwoodsProperties HIW are 25.83 and 27.22 | Monthly Target 1 | 25.59 | | Monthly Target 2 | 26.07 | | Monthly Target 3 | 26.98 | | Monthly Target 4 | 27.46 | | Monthly Target 5 | 28.37 |
Monthly price and volumes Highwoods Properties
| Date |
Closing |
Open |
Range |
Volume |
Thu 04 December 2025 |
26.55 (-4.5%) |
27.52 |
26.50 - 27.89 |
0.2531 times |
Fri 28 November 2025 |
27.80 (-2.9%) |
28.49 |
27.02 - 29.38 |
1.0197 times |
Fri 31 October 2025 |
28.63 (-10.03%) |
31.89 |
27.98 - 32.76 |
1.1175 times |
Tue 30 September 2025 |
31.82 (0.92%) |
31.17 |
30.79 - 32.62 |
1.1653 times |
Fri 29 August 2025 |
31.53 (8.69%) |
29.08 |
27.99 - 31.70 |
1.3189 times |
Thu 31 July 2025 |
29.01 (-6.69%) |
31.06 |
28.60 - 31.93 |
1.0131 times |
Mon 30 June 2025 |
31.09 (4.68%) |
29.47 |
29.22 - 32.04 |
0.914 times |
Fri 30 May 2025 |
29.70 (4.43%) |
28.28 |
28.10 - 30.99 |
1.0078 times |
Wed 30 April 2025 |
28.44 (-4.05%) |
29.76 |
24.19 - 29.94 |
1.003 times |
Mon 31 March 2025 |
29.64 (1.75%) |
29.06 |
27.63 - 29.93 |
1.1874 times |
Fri 28 February 2025 |
29.13 (-2.22%) |
29.10 |
27.40 - 29.85 |
1.0953 times |
DMA SMA EMA moving averages of Highwoods Properties HIW
DMA (daily moving average) of Highwoods Properties HIW
| DMA period | DMA value | | 5 day DMA | 27.27 | | 12 day DMA | 27.42 | | 20 day DMA | 28 | | 35 day DMA | 28.54 | | 50 day DMA | 29.39 | | 100 day DMA | 29.93 | | 150 day DMA | 30.07 | | 200 day DMA | 29.63 | EMA (exponential moving average) of Highwoods Properties HIW
| EMA period | EMA current | EMA prev | EMA prev2 | | 5 day EMA | 27.12 | 27.4 | 27.53 | | 12 day EMA | 27.51 | 27.69 | 27.79 | | 20 day EMA | 27.9 | 28.04 | 28.13 | | 35 day EMA | 28.65 | 28.77 | 28.87 | | 50 day EMA | 29.38 | 29.5 | 29.6 |
SMA (simple moving average) of Highwoods Properties HIW
| SMA period | SMA current | SMA prev | SMA prev2 | | 5 day SMA | 27.27 | 27.54 | 27.62 | | 12 day SMA | 27.42 | 27.52 | 27.69 | | 20 day SMA | 28 | 28.11 | 28.18 | | 35 day SMA | 28.54 | 28.64 | 28.72 | | 50 day SMA | 29.39 | 29.49 | 29.59 | | 100 day SMA | 29.93 | 29.98 | 30.02 | | 150 day SMA | 30.07 | 30.08 | 30.09 | | 200 day SMA | 29.63 | 29.64 | 29.65 |
|
|
