HuntingtonIngalls HII full analysis,charts,indicators,moving averages,SMA,DMA,EMA,ADX,MACD,RSIHuntington Ingalls HII WideScreen charts, DMA,SMA,EMA technical analysis, forecast prediction, by indicators ADX,MACD,RSI,CCI NYSE stock exchange
operates under Capital Goods sector & deals in Marine Transportation
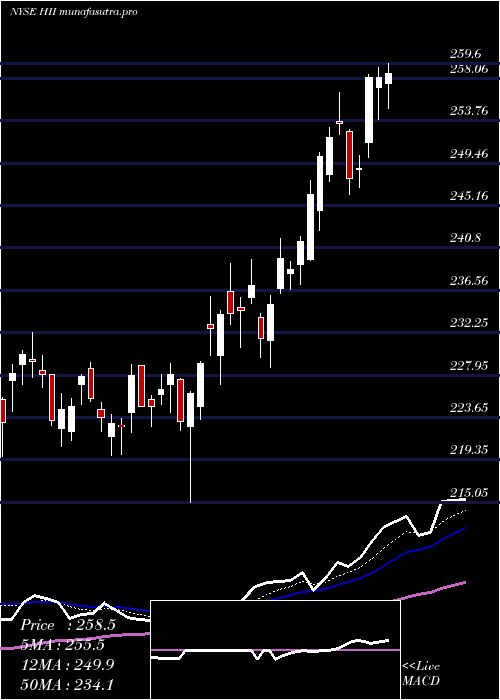
Daily price and charts and targets HuntingtonIngalls Strong Daily Stock price targets for HuntingtonIngalls HII are 312.14 and 322.35 | Daily Target 1 | 304.09 | | Daily Target 2 | 309.98 | | Daily Target 3 | 314.29666666667 | | Daily Target 4 | 320.19 | | Daily Target 5 | 324.51 |
Daily price and volume Huntington Ingalls
| Date |
Closing |
Open |
Range |
Volume |
Thu 04 December 2025 |
315.88 (2.15%) |
308.68 |
308.40 - 318.61 |
1.0108 times |
Wed 03 December 2025 |
309.23 (0.66%) |
307.08 |
304.01 - 310.16 |
0.9801 times |
Tue 02 December 2025 |
307.20 (0.18%) |
307.95 |
306.63 - 310.87 |
0.9346 times |
Mon 01 December 2025 |
306.65 (-2.22%) |
312.46 |
306.08 - 312.46 |
1.0083 times |
Fri 28 November 2025 |
313.62 (-0.22%) |
313.24 |
311.64 - 314.31 |
0.3759 times |
Wed 26 November 2025 |
314.31 (-0.13%) |
315.39 |
313.00 - 317.78 |
0.649 times |
Tue 25 November 2025 |
314.73 (1.55%) |
311.60 |
307.38 - 316.13 |
1.2783 times |
Mon 24 November 2025 |
309.92 (1.45%) |
302.18 |
300.77 - 311.30 |
0.7979 times |
Fri 21 November 2025 |
305.49 (1.21%) |
301.26 |
295.87 - 308.33 |
1.4585 times |
Thu 20 November 2025 |
301.83 (-2.55%) |
315.44 |
301.32 - 319.90 |
1.5065 times |
Wed 19 November 2025 |
309.74 (0.19%) |
307.00 |
304.80 - 311.05 |
0.8837 times |
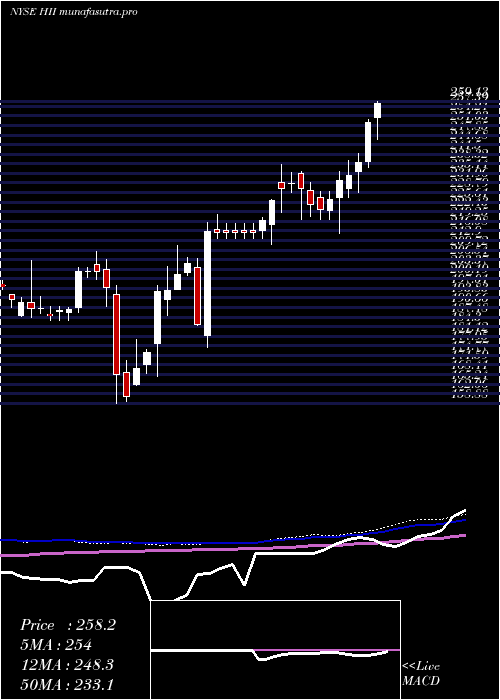
Weekly price and charts HuntingtonIngalls Strong weekly Stock price targets for HuntingtonIngalls HII are 309.95 and 324.55 | Weekly Target 1 | 298.23 | | Weekly Target 2 | 307.06 | | Weekly Target 3 | 312.83333333333 | | Weekly Target 4 | 321.66 | | Weekly Target 5 | 327.43 |
Weekly price and volumes for Huntington Ingalls
| Date |
Closing |
Open |
Range |
Volume |
Thu 04 December 2025 |
315.88 (0.72%) |
312.46 |
304.01 - 318.61 |
0.7362 times |
Fri 28 November 2025 |
313.62 (2.66%) |
302.18 |
300.77 - 317.78 |
0.5804 times |
Fri 21 November 2025 |
305.49 (-2.7%) |
314.00 |
295.87 - 319.90 |
1.0532 times |
Fri 14 November 2025 |
313.97 (1.42%) |
311.17 |
305.30 - 327.98 |
1.4147 times |
Fri 07 November 2025 |
309.56 (-3.87%) |
312.55 |
299.07 - 318.20 |
1.025 times |
Fri 31 October 2025 |
322.02 (0%) |
316.18 |
311.85 - 323.34 |
0.4167 times |
Fri 31 October 2025 |
322.02 (7.37%) |
304.00 |
296.30 - 330.00 |
1.7365 times |
Fri 24 October 2025 |
299.91 (7.1%) |
281.81 |
281.81 - 301.74 |
0.9809 times |
Fri 17 October 2025 |
280.02 (-1.05%) |
283.51 |
277.01 - 296.03 |
1.1914 times |
Fri 10 October 2025 |
282.99 (-0.44%) |
285.48 |
281.30 - 291.49 |
0.865 times |
Fri 03 October 2025 |
284.24 (1.96%) |
281.38 |
278.81 - 291.52 |
0.9397 times |
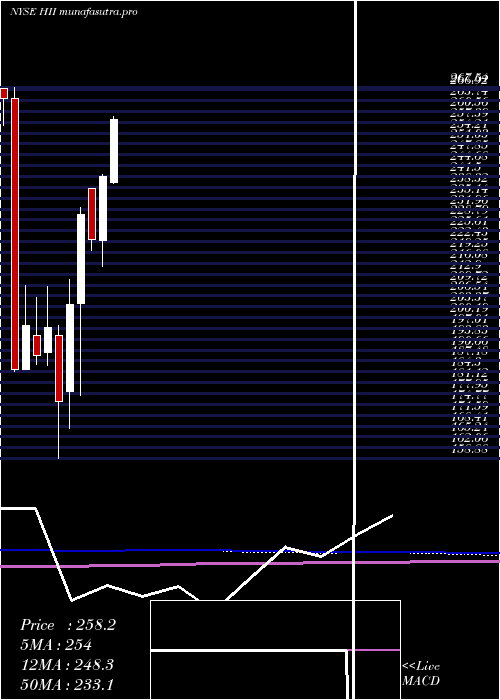
Monthly price and charts HuntingtonIngalls Strong monthly Stock price targets for HuntingtonIngalls HII are 309.95 and 324.55 | Monthly Target 1 | 298.23 | | Monthly Target 2 | 307.06 | | Monthly Target 3 | 312.83333333333 | | Monthly Target 4 | 321.66 | | Monthly Target 5 | 327.43 |
Monthly price and volumes Huntington Ingalls
| Date |
Closing |
Open |
Range |
Volume |
Thu 04 December 2025 |
315.88 (0.72%) |
312.46 |
304.01 - 318.61 |
0.1362 times |
Fri 28 November 2025 |
313.62 (-2.61%) |
312.55 |
295.87 - 327.98 |
0.7533 times |
Fri 31 October 2025 |
322.02 (11.85%) |
284.54 |
277.01 - 330.00 |
1.0619 times |
Tue 30 September 2025 |
287.91 (6.32%) |
269.64 |
264.00 - 288.11 |
0.978 times |
Fri 29 August 2025 |
270.79 (-2.89%) |
276.87 |
259.00 - 278.86 |
0.8514 times |
Thu 31 July 2025 |
278.86 (15.49%) |
239.68 |
239.55 - 293.14 |
1.0467 times |
Mon 30 June 2025 |
241.46 (8.25%) |
222.90 |
215.05 - 242.04 |
0.9478 times |
Fri 30 May 2025 |
223.06 (-3.16%) |
237.86 |
219.71 - 238.00 |
1.0637 times |
Wed 30 April 2025 |
230.34 (12.89%) |
204.42 |
177.42 - 232.35 |
1.5169 times |
Mon 31 March 2025 |
204.04 (16.21%) |
178.63 |
167.70 - 211.25 |
1.6441 times |
Fri 28 February 2025 |
175.58 (-10.99%) |
195.05 |
158.88 - 197.90 |
1.898 times |
DMA SMA EMA moving averages of Huntington Ingalls HII
DMA (daily moving average) of Huntington Ingalls HII
| DMA period | DMA value | | 5 day DMA | 310.52 | | 12 day DMA | 309.81 | | 20 day DMA | 311.49 | | 35 day DMA | 306.41 | | 50 day DMA | 299.86 | | 100 day DMA | 284.05 | | 150 day DMA | 267.41 | | 200 day DMA | 251 | EMA (exponential moving average) of Huntington Ingalls HII
| EMA period | EMA current | EMA prev | EMA prev2 | | 5 day EMA | 311.5 | 309.31 | 309.35 | | 12 day EMA | 310.79 | 309.86 | 309.97 | | 20 day EMA | 309.52 | 308.85 | 308.81 | | 35 day EMA | 304.39 | 303.71 | 303.38 | | 50 day EMA | 298.98 | 298.29 | 297.84 |
SMA (simple moving average) of Huntington Ingalls HII
| SMA period | SMA current | SMA prev | SMA prev2 | | 5 day SMA | 310.52 | 310.2 | 311.3 | | 12 day SMA | 309.81 | 309.3 | 309.7 | | 20 day SMA | 311.49 | 311.03 | 311.37 | | 35 day SMA | 306.41 | 305.53 | 305.03 | | 50 day SMA | 299.86 | 299.09 | 298.43 | | 100 day SMA | 284.05 | 283.43 | 282.92 | | 150 day SMA | 267.41 | 266.84 | 266.31 | | 200 day SMA | 251 | 250.31 | 249.63 |
|
|
