HartfordFinancial HIG full analysis,charts,indicators,moving averages,SMA,DMA,EMA,ADX,MACD,RSIHartford Financial HIG WideScreen charts, DMA,SMA,EMA technical analysis, forecast prediction, by indicators ADX,MACD,RSI,CCI NYSE stock exchange
operates under Finance sector & deals in Property Casualty Insurers
Daily price and charts and targets HartfordFinancial Strong Daily Stock price targets for HartfordFinancial HIG are 122.67 and 124.57 | Daily Target 1 | 122.27 | | Daily Target 2 | 123.06 | | Daily Target 3 | 124.17333333333 | | Daily Target 4 | 124.96 | | Daily Target 5 | 126.07 |
Daily price and volume Hartford Financial
| Date |
Closing |
Open |
Range |
Volume |
Mon 20 October 2025 |
123.84 (-0.5%) |
125.00 |
123.39 - 125.29 |
0.5273 times |
Fri 17 October 2025 |
124.46 (0.38%) |
124.01 |
123.48 - 125.31 |
1.4165 times |
Thu 16 October 2025 |
123.99 (-3.63%) |
125.10 |
123.58 - 125.29 |
1.7343 times |
Wed 15 October 2025 |
128.66 (-1.92%) |
130.41 |
127.64 - 130.77 |
1.3461 times |
Tue 14 October 2025 |
131.18 (1.9%) |
129.05 |
128.87 - 131.40 |
1.0371 times |
Mon 13 October 2025 |
128.74 (-3.79%) |
128.67 |
127.93 - 129.72 |
0.7817 times |
Tue 07 October 2025 |
133.81 (0.96%) |
132.66 |
132.11 - 133.96 |
1.029 times |
Mon 06 October 2025 |
132.54 (-0.69%) |
133.60 |
132.09 - 134.26 |
0.7951 times |
Fri 03 October 2025 |
133.46 (0.39%) |
132.69 |
132.62 - 134.22 |
0.8122 times |
Thu 02 October 2025 |
132.94 (0.03%) |
132.19 |
131.36 - 133.18 |
0.5206 times |
Wed 01 October 2025 |
132.90 (-0.37%) |
132.61 |
132.45 - 134.40 |
1.0005 times |
Weekly price and charts HartfordFinancial Strong weekly Stock price targets for HartfordFinancial HIG are 122.67 and 124.57 | Weekly Target 1 | 122.27 | | Weekly Target 2 | 123.06 | | Weekly Target 3 | 124.17333333333 | | Weekly Target 4 | 124.96 | | Weekly Target 5 | 126.07 |
Weekly price and volumes for Hartford Financial
| Date |
Closing |
Open |
Range |
Volume |
Mon 20 October 2025 |
123.84 (-0.5%) |
125.00 |
123.39 - 125.29 |
0.1295 times |
Fri 17 October 2025 |
124.46 (-6.99%) |
128.67 |
123.48 - 131.40 |
1.5507 times |
Tue 07 October 2025 |
133.81 (0.26%) |
133.60 |
132.09 - 134.26 |
0.4479 times |
Fri 03 October 2025 |
133.46 (0.26%) |
133.13 |
131.36 - 134.40 |
0.9466 times |
Fri 26 September 2025 |
133.11 (1.65%) |
130.58 |
129.95 - 134.12 |
1.2962 times |
Fri 19 September 2025 |
130.95 (-1.18%) |
132.59 |
129.57 - 133.32 |
1.8094 times |
Fri 12 September 2025 |
132.52 (0.65%) |
131.07 |
129.48 - 133.43 |
1.2788 times |
Fri 05 September 2025 |
131.67 (-0.48%) |
131.90 |
130.75 - 135.17 |
1.1818 times |
Fri 29 August 2025 |
132.31 (0%) |
132.58 |
131.93 - 133.24 |
0.2166 times |
Fri 29 August 2025 |
132.31 (-1.28%) |
133.55 |
131.88 - 133.95 |
1.1426 times |
Fri 22 August 2025 |
134.02 (2.65%) |
130.00 |
129.31 - 134.93 |
1.1811 times |
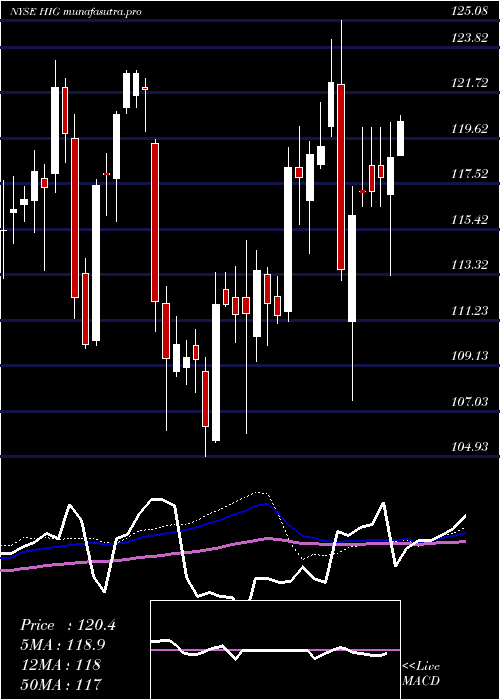
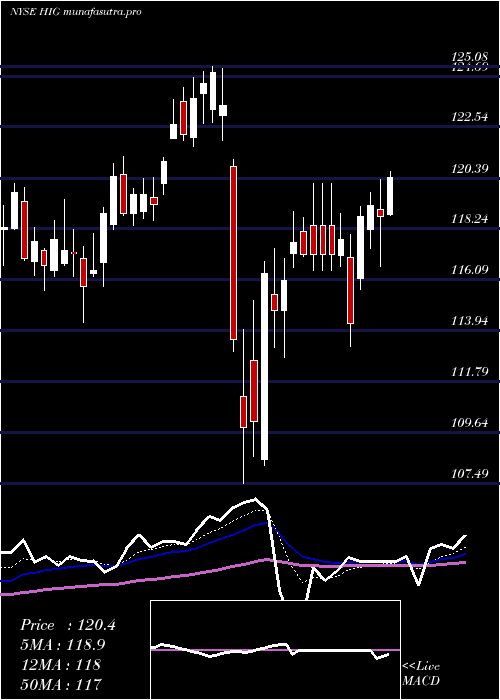
Monthly price and charts HartfordFinancial Strong monthly Stock price targets for HartfordFinancial HIG are 118.11 and 129.12 | Monthly Target 1 | 116.2 | | Monthly Target 2 | 120.02 | | Monthly Target 3 | 127.21 | | Monthly Target 4 | 131.03 | | Monthly Target 5 | 138.22 |
Monthly price and volumes Hartford Financial
| Date |
Closing |
Open |
Range |
Volume |
Mon 20 October 2025 |
123.84 (-7.16%) |
132.61 |
123.39 - 134.40 |
0.4594 times |
Tue 30 September 2025 |
133.39 (0.82%) |
131.90 |
129.48 - 135.17 |
1.0104 times |
Fri 29 August 2025 |
132.31 (6.37%) |
124.42 |
122.68 - 134.93 |
0.8817 times |
Thu 31 July 2025 |
124.39 (-1.95%) |
126.76 |
119.61 - 127.55 |
1.1444 times |
Mon 30 June 2025 |
126.87 (-2.29%) |
128.84 |
123.79 - 130.33 |
0.9312 times |
Fri 30 May 2025 |
129.84 (5.84%) |
121.33 |
120.86 - 132.09 |
1.1362 times |
Wed 30 April 2025 |
122.67 (-0.86%) |
123.94 |
107.49 - 125.08 |
1.0847 times |
Mon 31 March 2025 |
123.73 (4.61%) |
118.26 |
114.28 - 124.64 |
1.0771 times |
Fri 28 February 2025 |
118.28 (6.03%) |
110.45 |
109.30 - 119.22 |
1.1311 times |
Fri 31 January 2025 |
111.55 (1.97%) |
110.00 |
104.93 - 114.89 |
1.1437 times |
Tue 31 December 2024 |
109.40 (-10.78%) |
121.95 |
106.11 - 122.39 |
0.9149 times |

DMA SMA EMA moving averages of Hartford Financial HIG
DMA (daily moving average) of Hartford Financial HIG
| DMA period | DMA value | | 5 day DMA | 126.43 | | 12 day DMA | 129.99 | | 20 day DMA | 130.68 | | 35 day DMA | 131.2 | | 50 day DMA | 131.18 | | 100 day DMA | 128.23 | | 150 day DMA | 125.94 | | 200 day DMA | 122.6 | EMA (exponential moving average) of Hartford Financial HIG
| EMA period | EMA current | EMA prev | EMA prev2 | | 5 day EMA | 125.99 | 127.07 | 128.38 | | 12 day EMA | 128.54 | 129.39 | 130.29 | | 20 day EMA | 129.62 | 130.23 | 130.84 | | 35 day EMA | 130.21 | 130.58 | 130.94 | | 50 day EMA | 130.22 | 130.48 | 130.73 |
SMA (simple moving average) of Hartford Financial HIG
| SMA period | SMA current | SMA prev | SMA prev2 | | 5 day SMA | 126.43 | 127.41 | 129.28 | | 12 day SMA | 129.99 | 130.69 | 131.41 | | 20 day SMA | 130.68 | 131.02 | 131.28 | | 35 day SMA | 131.2 | 131.47 | 131.7 | | 50 day SMA | 131.18 | 131.28 | 131.34 | | 100 day SMA | 128.23 | 128.29 | 128.35 | | 150 day SMA | 125.94 | 125.9 | 125.86 | | 200 day SMA | 122.6 | 122.54 | 122.47 |
|
|
