HdfcBank HDB full analysis,charts,indicators,moving averages,SMA,DMA,EMA,ADX,MACD,RSIHdfc Bank HDB WideScreen charts, DMA,SMA,EMA technical analysis, forecast prediction, by indicators ADX,MACD,RSI,CCI NYSE stock exchange
operates under Finance sector & deals in Commercial Banks
Daily price and charts and targets HdfcBank Strong Daily Stock price targets for HdfcBank HDB are 35.85 and 36.2 | Daily Target 1 | 35.58 | | Daily Target 2 | 35.77 | | Daily Target 3 | 35.93 | | Daily Target 4 | 36.12 | | Daily Target 5 | 36.28 |
Daily price and volume Hdfc Bank
| Date |
Closing |
Open |
Range |
Volume |
Thu 04 December 2025 |
35.96 (0.25%) |
35.82 |
35.74 - 36.09 |
0.6643 times |
Wed 03 December 2025 |
35.87 (0.08%) |
36.19 |
35.86 - 36.35 |
0.7976 times |
Tue 02 December 2025 |
35.84 (1.13%) |
35.40 |
35.40 - 35.87 |
1.0881 times |
Mon 01 December 2025 |
35.44 (-3.75%) |
36.70 |
35.16 - 36.78 |
2.3932 times |
Fri 28 November 2025 |
36.82 (0.52%) |
36.82 |
36.69 - 37.01 |
0.4331 times |
Wed 26 November 2025 |
36.63 (1.24%) |
36.50 |
36.43 - 36.77 |
0.6135 times |
Tue 25 November 2025 |
36.18 (-0.6%) |
36.13 |
35.55 - 36.22 |
0.7457 times |
Mon 24 November 2025 |
36.40 (-0.74%) |
36.74 |
36.27 - 36.74 |
0.7473 times |
Fri 21 November 2025 |
36.67 (-0.57%) |
36.71 |
36.43 - 37.05 |
1.3368 times |
Thu 20 November 2025 |
36.88 (1.15%) |
36.85 |
36.82 - 37.35 |
1.1804 times |
Wed 19 November 2025 |
36.46 (-1.8%) |
37.01 |
36.43 - 37.12 |
0.8245 times |
Weekly price and charts HdfcBank Strong weekly Stock price targets for HdfcBank HDB are 34.75 and 36.37 | Weekly Target 1 | 34.35 | | Weekly Target 2 | 35.15 | | Weekly Target 3 | 35.966666666667 | | Weekly Target 4 | 36.77 | | Weekly Target 5 | 37.59 |
Weekly price and volumes for Hdfc Bank
| Date |
Closing |
Open |
Range |
Volume |
Thu 04 December 2025 |
35.96 (-2.34%) |
36.70 |
35.16 - 36.78 |
1.2025 times |
Fri 28 November 2025 |
36.82 (0.41%) |
36.74 |
35.55 - 37.01 |
0.6178 times |
Fri 21 November 2025 |
36.67 (0.63%) |
36.41 |
36.41 - 37.35 |
1.3621 times |
Fri 14 November 2025 |
36.44 (1.76%) |
35.82 |
35.65 - 36.75 |
0.9871 times |
Fri 07 November 2025 |
35.81 (-1.13%) |
36.23 |
35.51 - 36.37 |
1.0868 times |
Fri 31 October 2025 |
36.22 (0%) |
36.32 |
35.93 - 36.38 |
0.2345 times |
Fri 31 October 2025 |
36.22 (-1.47%) |
36.89 |
35.93 - 37.31 |
1.2928 times |
Fri 24 October 2025 |
36.76 (0.05%) |
36.83 |
36.25 - 37.45 |
1.1613 times |
Fri 17 October 2025 |
36.74 (5.24%) |
34.82 |
34.68 - 36.95 |
1.6359 times |
Tue 07 October 2025 |
34.91 (-0.54%) |
34.50 |
34.28 - 35.16 |
0.4193 times |
Fri 03 October 2025 |
35.10 (2.78%) |
34.20 |
33.78 - 35.10 |
1.0423 times |
Monthly price and charts HdfcBank Strong monthly Stock price targets for HdfcBank HDB are 34.75 and 36.37 | Monthly Target 1 | 34.35 | | Monthly Target 2 | 35.15 | | Monthly Target 3 | 35.966666666667 | | Monthly Target 4 | 36.77 | | Monthly Target 5 | 37.59 |
Monthly price and volumes Hdfc Bank
| Date |
Closing |
Open |
Range |
Volume |
Thu 04 December 2025 |
35.96 (-2.34%) |
36.70 |
35.16 - 36.78 |
0.3487 times |
Fri 28 November 2025 |
36.82 (1.66%) |
36.23 |
35.51 - 37.35 |
1.1756 times |
Fri 31 October 2025 |
36.22 (6.03%) |
34.70 |
33.78 - 37.45 |
1.5601 times |
Tue 30 September 2025 |
34.16 (-52%) |
70.56 |
33.93 - 71.23 |
1.1988 times |
Fri 29 August 2025 |
71.16 (-7.31%) |
77.45 |
70.77 - 77.45 |
0.6354 times |
Thu 31 July 2025 |
76.77 (0.13%) |
76.76 |
74.31 - 79.61 |
0.8187 times |
Mon 30 June 2025 |
76.67 (1.7%) |
75.20 |
73.30 - 78.14 |
0.8224 times |
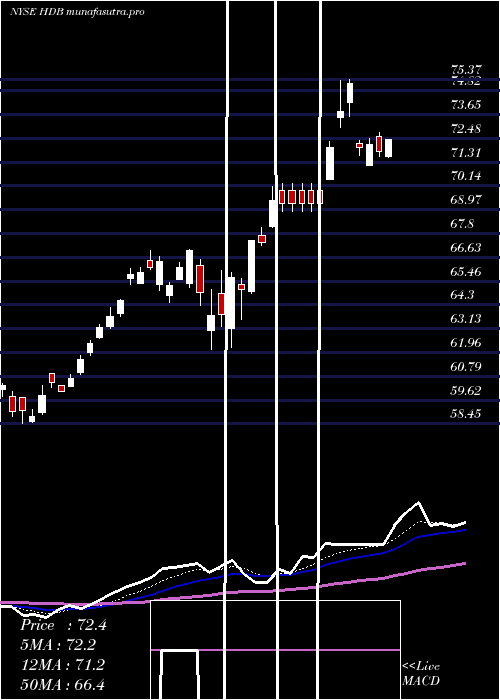
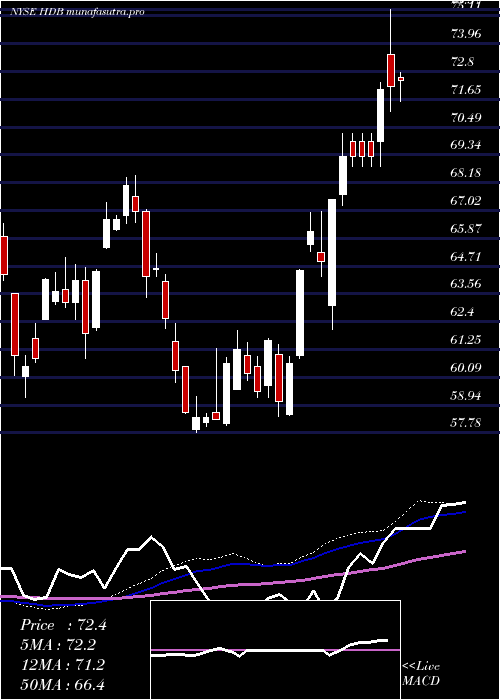
Fri 30 May 2025 |
75.39 (3.71%) |
72.68 |
69.14 - 75.60 |
0.8893 times |
Wed 30 April 2025 |
72.69 (9.41%) |
64.74 |
62.08 - 75.37 |
1.5475 times |
Mon 31 March 2025 |
66.44 (7.82%) |
61.04 |
58.45 - 66.95 |
1.0034 times |
Fri 28 February 2025 |
61.62 (1.62%) |
59.59 |
59.25 - 62.02 |
0.8487 times |

DMA SMA EMA moving averages of Hdfc Bank HDB
DMA (daily moving average) of Hdfc Bank HDB
| DMA period | DMA value | | 5 day DMA | 35.99 | | 12 day DMA | 36.36 | | 20 day DMA | 36.33 | | 35 day DMA | 36.41 | | 50 day DMA | 35.89 | | 100 day DMA | 51.38 | | 150 day DMA | 59.06 | | 200 day DMA | 60.39 | EMA (exponential moving average) of Hdfc Bank HDB
| EMA period | EMA current | EMA prev | EMA prev2 | | 5 day EMA | 36 | 36.02 | 36.1 | | 12 day EMA | 36.19 | 36.23 | 36.3 | | 20 day EMA | 36.24 | 36.27 | 36.31 | | 35 day EMA | 36.07 | 36.08 | 36.09 | | 50 day EMA | 35.85 | 35.85 | 35.85 |
SMA (simple moving average) of Hdfc Bank HDB
| SMA period | SMA current | SMA prev | SMA prev2 | | 5 day SMA | 35.99 | 36.12 | 36.18 | | 12 day SMA | 36.36 | 36.43 | 36.48 | | 20 day SMA | 36.33 | 36.32 | 36.34 | | 35 day SMA | 36.41 | 36.42 | 36.4 | | 50 day SMA | 35.89 | 35.88 | 35.87 | | 100 day SMA | 51.38 | 51.78 | 52.19 | | 150 day SMA | 59.06 | 59.3 | 59.55 | | 200 day SMA | 60.39 | 60.51 | 60.63 |
|
|
