HomeDepot HD full analysis,charts,indicators,moving averages,SMA,DMA,EMA,ADX,MACD,RSIHome Depot HD WideScreen charts, DMA,SMA,EMA technical analysis, forecast prediction, by indicators ADX,MACD,RSI,CCI NYSE stock exchange
operates under Consumer Services sector & deals in RETAIL Building Materials
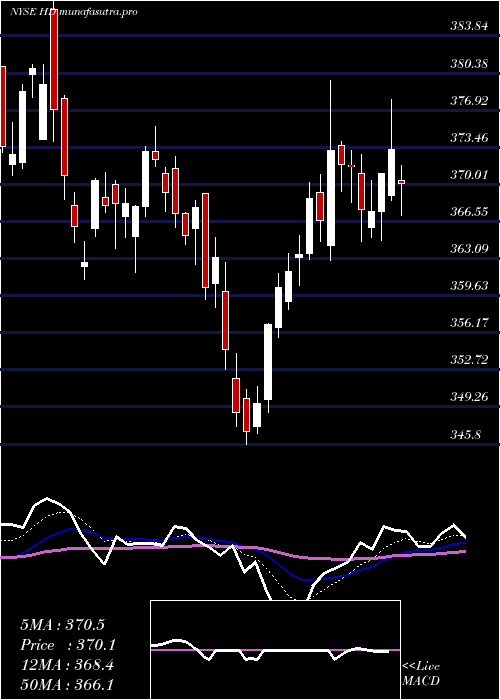
Daily price and charts and targets HomeDepot Strong Daily Stock price targets for HomeDepot HD are 346.83 and 354.34 | Daily Target 1 | 345.38 | | Daily Target 2 | 348.28 | | Daily Target 3 | 352.89333333333 | | Daily Target 4 | 355.79 | | Daily Target 5 | 360.4 |
Daily price and volume Home Depot
| Date |
Closing |
Open |
Range |
Volume |
Thu 04 December 2025 |
351.17 (-1.88%) |
356.29 |
350.00 - 357.51 |
0.9742 times |
Wed 03 December 2025 |
357.91 (1.1%) |
354.50 |
353.75 - 360.47 |
1.0091 times |
Tue 02 December 2025 |
354.03 (-0.92%) |
356.83 |
351.30 - 357.50 |
0.9603 times |
Mon 01 December 2025 |
357.33 (0.11%) |
354.05 |
352.88 - 362.29 |
1.2368 times |
Fri 28 November 2025 |
356.92 (0.41%) |
354.93 |
353.50 - 357.83 |
0.5133 times |
Wed 26 November 2025 |
355.47 (1.22%) |
350.26 |
349.00 - 357.33 |
1.094 times |
Tue 25 November 2025 |
351.17 (4.33%) |
337.01 |
336.50 - 353.00 |
0.8851 times |
Mon 24 November 2025 |
336.61 (-1.95%) |
343.11 |
336.55 - 344.00 |
0.5503 times |
Fri 21 November 2025 |
343.32 (3.29%) |
334.57 |
333.00 - 346.92 |
1.8021 times |
Thu 20 November 2025 |
332.38 (-0.63%) |
336.36 |
332.13 - 338.90 |
0.9748 times |
Wed 19 November 2025 |
334.50 (-0.6%) |
340.97 |
331.37 - 341.75 |
1.8393 times |
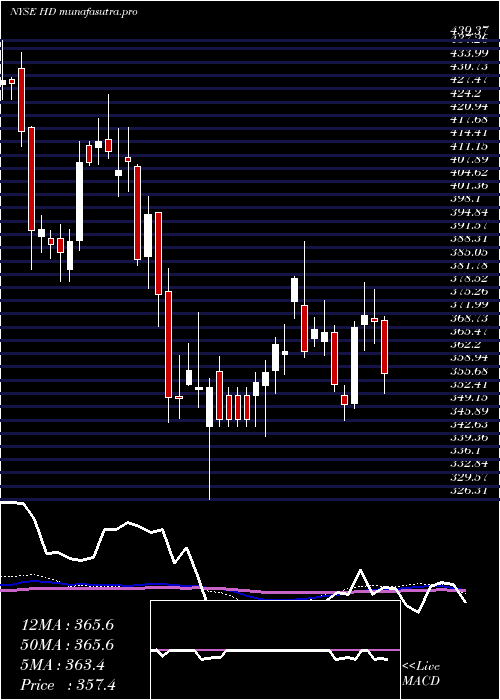
Weekly price and charts HomeDepot Strong weekly Stock price targets for HomeDepot HD are 344.44 and 356.73 | Weekly Target 1 | 342.2 | | Weekly Target 2 | 346.68 | | Weekly Target 3 | 354.48666666667 | | Weekly Target 4 | 358.97 | | Weekly Target 5 | 366.78 |
Weekly price and volumes for Home Depot
| Date |
Closing |
Open |
Range |
Volume |
Thu 04 December 2025 |
351.17 (-1.61%) |
354.05 |
350.00 - 362.29 |
1.2658 times |
Fri 28 November 2025 |
356.92 (3.96%) |
343.11 |
336.50 - 357.83 |
0.9213 times |
Fri 21 November 2025 |
343.32 (-5.25%) |
361.13 |
331.37 - 363.78 |
2.2631 times |
Fri 14 November 2025 |
362.36 (-2.36%) |
369.79 |
359.80 - 376.00 |
1.1351 times |
Fri 07 November 2025 |
371.11 (-2.23%) |
377.12 |
367.55 - 383.68 |
0.783 times |
Fri 31 October 2025 |
379.59 (0%) |
376.96 |
375.01 - 380.94 |
0.1939 times |
Fri 31 October 2025 |
379.59 (-1.85%) |
387.70 |
375.01 - 390.01 |
1.0499 times |
Fri 24 October 2025 |
386.75 (-1.31%) |
391.41 |
381.30 - 393.63 |
0.8403 times |
Fri 17 October 2025 |
391.90 (1.32%) |
379.07 |
377.19 - 394.37 |
1.2068 times |
Tue 07 October 2025 |
386.81 (-2.09%) |
395.63 |
385.51 - 395.80 |
0.3407 times |
Fri 03 October 2025 |
395.06 (-3.67%) |
410.05 |
392.63 - 410.95 |
0.9903 times |
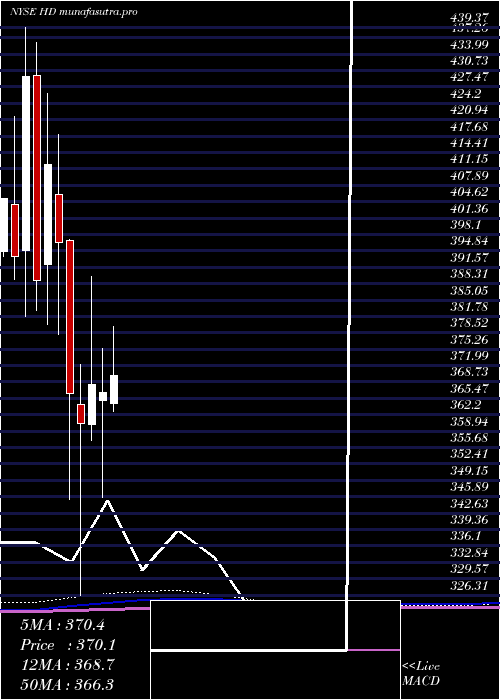
Monthly price and charts HomeDepot Strong monthly Stock price targets for HomeDepot HD are 344.44 and 356.73 | Monthly Target 1 | 342.2 | | Monthly Target 2 | 346.68 | | Monthly Target 3 | 354.48666666667 | | Monthly Target 4 | 358.97 | | Monthly Target 5 | 366.78 |
Monthly price and volumes Home Depot
| Date |
Closing |
Open |
Range |
Volume |
Thu 04 December 2025 |
351.17 (-1.61%) |
354.05 |
350.00 - 362.29 |
0.2605 times |
Fri 28 November 2025 |
356.92 (-5.97%) |
377.12 |
331.37 - 383.68 |
1.0501 times |
Fri 31 October 2025 |
379.59 (-6.32%) |
404.39 |
375.01 - 405.13 |
0.8573 times |
Tue 30 September 2025 |
405.19 (-0.39%) |
403.68 |
402.75 - 426.75 |
1.2058 times |
Fri 29 August 2025 |
406.77 (10.68%) |
367.82 |
365.75 - 414.50 |
1.1141 times |
Thu 31 July 2025 |
367.51 (0.24%) |
364.34 |
352.46 - 381.08 |
1.0897 times |
Mon 30 June 2025 |
366.64 (-0.45%) |
365.15 |
345.80 - 375.37 |
1.0642 times |
Fri 30 May 2025 |
368.29 (2.16%) |
360.31 |
357.13 - 389.75 |
1.0244 times |
Wed 30 April 2025 |
360.49 (-1.64%) |
364.14 |
326.31 - 372.31 |
1.1589 times |
Mon 31 March 2025 |
366.49 (-7.59%) |
396.95 |
345.26 - 397.07 |
1.1751 times |
Fri 28 February 2025 |
396.60 (-3.73%) |
406.12 |
378.20 - 418.00 |
0.9749 times |
DMA SMA EMA moving averages of Home Depot HD
DMA (daily moving average) of Home Depot HD
| DMA period | DMA value | | 5 day DMA | 355.47 | | 12 day DMA | 347.28 | | 20 day DMA | 355.59 | | 35 day DMA | 367.89 | | 50 day DMA | 377.13 | | 100 day DMA | 385.89 | | 150 day DMA | 379.29 | | 200 day DMA | 375.86 | EMA (exponential moving average) of Home Depot HD
| EMA period | EMA current | EMA prev | EMA prev2 | | 5 day EMA | 353.67 | 354.92 | 353.42 | | 12 day EMA | 353.81 | 354.29 | 353.63 | | 20 day EMA | 357.75 | 358.44 | 358.5 | | 35 day EMA | 367.09 | 368.03 | 368.63 | | 50 day EMA | 378.39 | 379.5 | 380.38 |
SMA (simple moving average) of Home Depot HD
| SMA period | SMA current | SMA prev | SMA prev2 | | 5 day SMA | 355.47 | 356.33 | 354.98 | | 12 day SMA | 347.28 | 347.85 | 348.22 | | 20 day SMA | 355.59 | 356.72 | 357.98 | | 35 day SMA | 367.89 | 368.95 | 369.81 | | 50 day SMA | 377.13 | 378.42 | 379.61 | | 100 day SMA | 385.89 | 386.11 | 386.24 | | 150 day SMA | 379.29 | 379.34 | 379.35 | | 200 day SMA | 375.86 | 376.17 | 376.42 |
|
|
