HamiltonBeach HBB full analysis,charts,indicators,moving averages,SMA,DMA,EMA,ADX,MACD,RSIHamilton Beach HBB WideScreen charts, DMA,SMA,EMA technical analysis, forecast prediction, by indicators ADX,MACD,RSI,CCI NYSE stock exchange
operates under Consumer Durables sector & deals in Home Furnishings
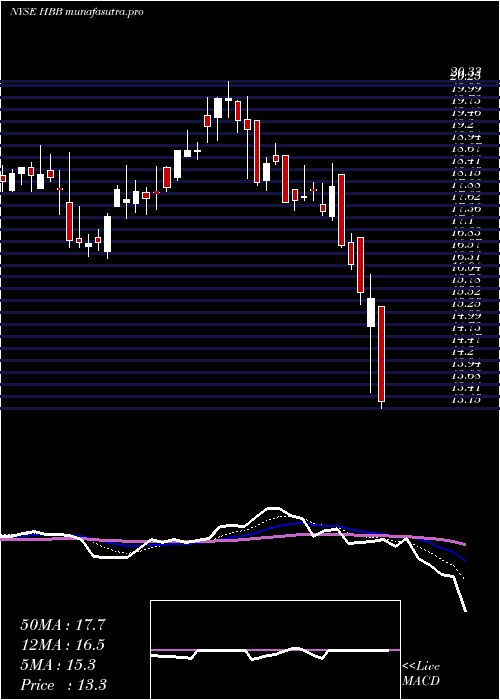
Daily price and charts and targets HamiltonBeach Strong Daily Stock price targets for HamiltonBeach HBB are 15.64 and 16.54 | Daily Target 1 | 15.41 | | Daily Target 2 | 15.86 | | Daily Target 3 | 16.313333333333 | | Daily Target 4 | 16.76 | | Daily Target 5 | 17.21 |
Daily price and volume Hamilton Beach
| Date |
Closing |
Open |
Range |
Volume |
Fri 05 December 2025 |
16.30 (2%) |
16.33 |
15.87 - 16.77 |
4.3365 times |
Thu 04 December 2025 |
15.98 (-3.91%) |
16.45 |
15.82 - 16.50 |
0.4363 times |
Wed 03 December 2025 |
16.63 (6.06%) |
16.15 |
16.14 - 16.81 |
1.0256 times |
Tue 02 December 2025 |
15.68 (-0.13%) |
15.57 |
15.57 - 16.00 |
0.7827 times |
Mon 01 December 2025 |
15.70 (-1.57%) |
16.03 |
15.70 - 16.08 |
0.5263 times |
Fri 28 November 2025 |
15.95 (2.37%) |
15.50 |
15.50 - 16.08 |
0.4139 times |
Wed 26 November 2025 |
15.58 (-1.52%) |
15.64 |
15.47 - 16.00 |
0.6298 times |
Tue 25 November 2025 |
15.82 (3.81%) |
15.95 |
15.70 - 16.04 |
0.3824 times |
Mon 24 November 2025 |
15.24 (-3.18%) |
15.63 |
15.24 - 15.96 |
0.3869 times |
Fri 21 November 2025 |
15.74 (9.53%) |
14.43 |
14.14 - 15.93 |
1.0796 times |
Thu 20 November 2025 |
14.37 (1.48%) |
13.96 |
13.92 - 14.39 |
0.5893 times |
Weekly price and charts HamiltonBeach Strong weekly Stock price targets for HamiltonBeach HBB are 15.94 and 17.18 | Weekly Target 1 | 14.99 | | Weekly Target 2 | 15.64 | | Weekly Target 3 | 16.226666666667 | | Weekly Target 4 | 16.88 | | Weekly Target 5 | 17.47 |
Weekly price and volumes for Hamilton Beach
| Date |
Closing |
Open |
Range |
Volume |
Fri 05 December 2025 |
16.30 (2.19%) |
16.03 |
15.57 - 16.81 |
1.8875 times |
Fri 28 November 2025 |
15.95 (1.33%) |
15.63 |
15.24 - 16.08 |
0.4814 times |
Fri 21 November 2025 |
15.74 (10.92%) |
14.20 |
13.75 - 15.93 |
1.0023 times |
Fri 14 November 2025 |
14.19 (2.23%) |
14.10 |
13.78 - 14.69 |
0.7717 times |
Fri 07 November 2025 |
13.88 (-1.35%) |
13.80 |
13.75 - 14.73 |
1.1349 times |
Fri 31 October 2025 |
14.07 (0%) |
13.86 |
13.86 - 14.28 |
0.1338 times |
Fri 31 October 2025 |
14.07 (-6.07%) |
14.99 |
13.86 - 15.20 |
1.0322 times |
Fri 24 October 2025 |
14.98 (-3.04%) |
15.51 |
14.50 - 15.94 |
1.3488 times |
Fri 17 October 2025 |
15.45 (6.85%) |
13.99 |
13.86 - 15.65 |
1.7346 times |
Tue 07 October 2025 |
14.46 (-2.82%) |
14.86 |
14.38 - 15.53 |
0.4727 times |
Fri 03 October 2025 |
14.88 (3.19%) |
14.46 |
13.65 - 15.21 |
1.2195 times |
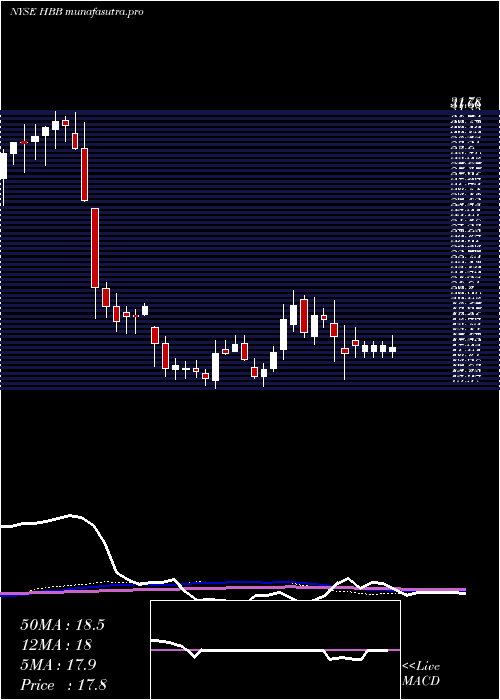
Monthly price and charts HamiltonBeach Strong monthly Stock price targets for HamiltonBeach HBB are 15.94 and 17.18 | Monthly Target 1 | 14.99 | | Monthly Target 2 | 15.64 | | Monthly Target 3 | 16.226666666667 | | Monthly Target 4 | 16.88 | | Monthly Target 5 | 17.47 |
Monthly price and volumes Hamilton Beach
| Date |
Closing |
Open |
Range |
Volume |
Fri 05 December 2025 |
16.30 (2.19%) |
16.03 |
15.57 - 16.81 |
0.244 times |
Fri 28 November 2025 |
15.95 (13.36%) |
13.80 |
13.75 - 16.08 |
0.4382 times |
Fri 31 October 2025 |
14.07 (-2.09%) |
14.21 |
13.86 - 15.94 |
0.6937 times |
Tue 30 September 2025 |
14.37 (-2.51%) |
14.45 |
13.56 - 15.45 |
0.8034 times |
Fri 29 August 2025 |
14.74 (-5.33%) |
15.40 |
12.72 - 15.81 |
1.1107 times |
Thu 31 July 2025 |
15.57 (-12.97%) |
18.45 |
13.50 - 20.33 |
1.1004 times |
Mon 30 June 2025 |
17.89 (-2.08%) |
18.20 |
16.45 - 18.93 |
0.8069 times |
Fri 30 May 2025 |
18.27 (-7.73%) |
18.53 |
13.25 - 19.09 |
1.5867 times |
Wed 30 April 2025 |
19.80 (1.9%) |
19.17 |
15.90 - 20.60 |
2.0695 times |
Mon 31 March 2025 |
19.43 (-0.31%) |
19.20 |
18.01 - 21.20 |
1.1464 times |
Fri 28 February 2025 |
19.49 (13.91%) |
16.65 |
15.48 - 20.37 |
0.9392 times |

DMA SMA EMA moving averages of Hamilton Beach HBB
DMA (daily moving average) of Hamilton Beach HBB
| DMA period | DMA value | | 5 day DMA | 16.06 | | 12 day DMA | 15.6 | | 20 day DMA | 14.94 | | 35 day DMA | 14.81 | | 50 day DMA | 14.71 | | 100 day DMA | 14.98 | | 150 day DMA | 15.9 | | 200 day DMA | 16.61 | EMA (exponential moving average) of Hamilton Beach HBB
| EMA period | EMA current | EMA prev | EMA prev2 | | 5 day EMA | 16.07 | 15.96 | 15.95 | | 12 day EMA | 15.63 | 15.51 | 15.43 | | 20 day EMA | 15.3 | 15.19 | 15.11 | | 35 day EMA | 15.03 | 14.95 | 14.89 | | 50 day EMA | 14.85 | 14.79 | 14.74 |
SMA (simple moving average) of Hamilton Beach HBB
| SMA period | SMA current | SMA prev | SMA prev2 | | 5 day SMA | 16.06 | 15.99 | 15.91 | | 12 day SMA | 15.6 | 15.39 | 15.21 | | 20 day SMA | 14.94 | 14.83 | 14.76 | | 35 day SMA | 14.81 | 14.78 | 14.76 | | 50 day SMA | 14.71 | 14.68 | 14.65 | | 100 day SMA | 14.98 | 15.01 | 15.05 | | 150 day SMA | 15.9 | 15.92 | 15.94 | | 200 day SMA | 16.61 | 16.61 | 16.62 |
|
|
