HalliburtonCompany HAL full analysis,charts,indicators,moving averages,SMA,DMA,EMA,ADX,MACD,RSIHalliburton Company HAL WideScreen charts, DMA,SMA,EMA technical analysis, forecast prediction, by indicators ADX,MACD,RSI,CCI NYSE stock exchange
operates under Energy sector & deals in Oilfield Services Equipment
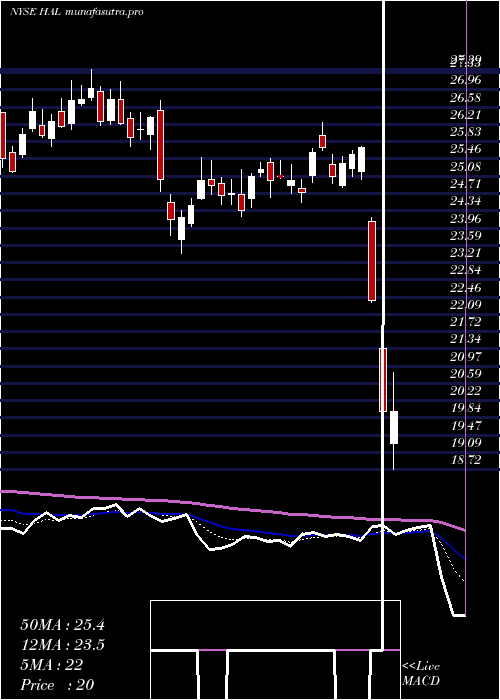
Daily price and charts and targets HalliburtonCompany Strong Daily Stock price targets for HalliburtonCompany HAL are 28.11 and 28.99 | Daily Target 1 | 27.41 | | Daily Target 2 | 27.93 | | Daily Target 3 | 28.29 | | Daily Target 4 | 28.81 | | Daily Target 5 | 29.17 |
Daily price and volume Halliburton Company
| Date |
Closing |
Open |
Range |
Volume |
Fri 05 December 2025 |
28.45 (2.19%) |
27.81 |
27.77 - 28.65 |
1.0773 times |
Thu 04 December 2025 |
27.84 (1.61%) |
27.33 |
27.25 - 27.96 |
0.6863 times |
Wed 03 December 2025 |
27.40 (1.82%) |
26.91 |
26.90 - 27.42 |
1.1994 times |
Tue 02 December 2025 |
26.91 (1.05%) |
26.59 |
26.04 - 27.01 |
1.2905 times |
Mon 01 December 2025 |
26.63 (1.56%) |
26.22 |
26.18 - 27.00 |
1.2002 times |
Fri 28 November 2025 |
26.22 (1.67%) |
25.64 |
25.63 - 26.42 |
0.4548 times |
Wed 26 November 2025 |
25.79 (0.35%) |
25.79 |
25.59 - 26.12 |
0.9096 times |
Tue 25 November 2025 |
25.70 (0.08%) |
25.75 |
24.98 - 25.84 |
0.8465 times |
Mon 24 November 2025 |
25.68 (-0.54%) |
25.72 |
25.26 - 25.94 |
0.8079 times |
Fri 21 November 2025 |
25.82 (0.78%) |
25.37 |
24.92 - 25.86 |
1.5273 times |
Thu 20 November 2025 |
25.62 (-3.17%) |
26.64 |
25.47 - 27.08 |
1.4371 times |
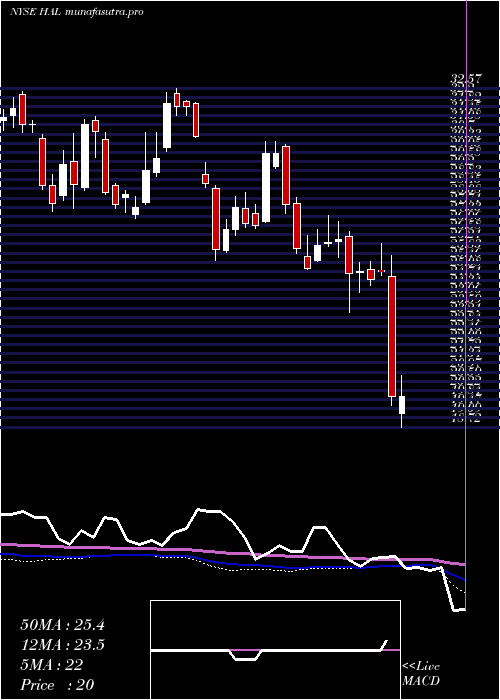
Weekly price and charts HalliburtonCompany Strong weekly Stock price targets for HalliburtonCompany HAL are 27.25 and 29.86 | Weekly Target 1 | 25.1 | | Weekly Target 2 | 26.78 | | Weekly Target 3 | 27.713333333333 | | Weekly Target 4 | 29.39 | | Weekly Target 5 | 30.32 |
Weekly price and volumes for Halliburton Company
| Date |
Closing |
Open |
Range |
Volume |
Fri 05 December 2025 |
28.45 (8.5%) |
26.22 |
26.04 - 28.65 |
1.0543 times |
Fri 28 November 2025 |
26.22 (1.55%) |
25.72 |
24.98 - 26.42 |
0.5836 times |
Fri 21 November 2025 |
25.82 (-5.42%) |
27.19 |
24.92 - 27.44 |
1.1265 times |
Fri 14 November 2025 |
27.30 (-0.98%) |
27.78 |
26.56 - 28.66 |
1.0185 times |
Fri 07 November 2025 |
27.57 (2.72%) |
27.15 |
26.68 - 28.13 |
0.6229 times |
Fri 31 October 2025 |
26.84 (0%) |
27.09 |
26.47 - 27.24 |
0.2033 times |
Fri 31 October 2025 |
26.84 (1.02%) |
26.95 |
26.44 - 27.65 |
1.0849 times |
Fri 24 October 2025 |
26.57 (19.31%) |
22.15 |
22.15 - 27.47 |
2.1114 times |
Fri 17 October 2025 |
22.27 (-8.28%) |
22.32 |
21.46 - 22.98 |
1.7725 times |
Tue 07 October 2025 |
24.28 (-0.25%) |
24.46 |
23.67 - 24.64 |
0.4221 times |
Fri 03 October 2025 |
24.34 (-3.07%) |
24.96 |
24.03 - 25.18 |
1.2635 times |
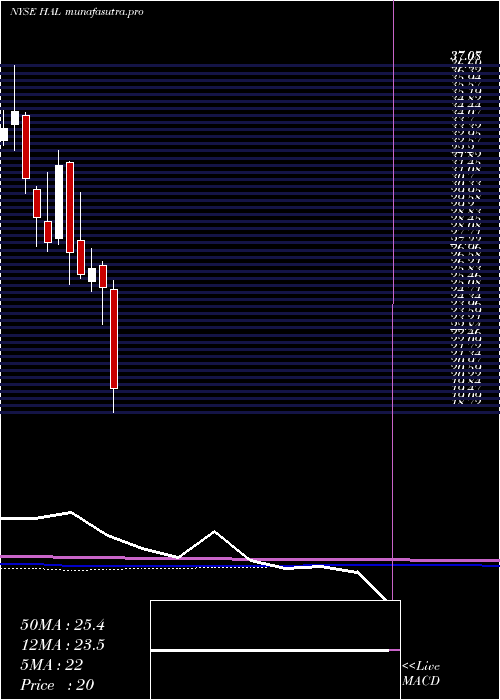
Monthly price and charts HalliburtonCompany Strong monthly Stock price targets for HalliburtonCompany HAL are 27.25 and 29.86 | Monthly Target 1 | 25.1 | | Monthly Target 2 | 26.78 | | Monthly Target 3 | 27.713333333333 | | Monthly Target 4 | 29.39 | | Monthly Target 5 | 30.32 |
Monthly price and volumes Halliburton Company
| Date |
Closing |
Open |
Range |
Volume |
Fri 05 December 2025 |
28.45 (8.5%) |
26.22 |
26.04 - 28.65 |
0.191 times |
Fri 28 November 2025 |
26.22 (-2.31%) |
27.15 |
24.92 - 28.66 |
0.6072 times |
Fri 31 October 2025 |
26.84 (9.11%) |
24.59 |
21.46 - 27.65 |
1.1286 times |
Tue 30 September 2025 |
24.60 (8.23%) |
22.67 |
21.40 - 25.68 |
1.1755 times |
Fri 29 August 2025 |
22.73 (1.47%) |
22.14 |
20.39 - 22.86 |
0.8889 times |
Thu 31 July 2025 |
22.40 (9.91%) |
20.30 |
20.09 - 23.17 |
1.394 times |
Mon 30 June 2025 |
20.38 (4.03%) |
20.11 |
19.53 - 23.50 |
1.1825 times |
Fri 30 May 2025 |
19.59 (-1.16%) |
19.84 |
19.22 - 22.19 |
1.2706 times |
Wed 30 April 2025 |
19.82 (-21.88%) |
25.25 |
18.72 - 25.74 |
1.0777 times |
Mon 31 March 2025 |
25.37 (-3.79%) |
26.52 |
23.42 - 26.73 |
1.0838 times |
Fri 28 February 2025 |
26.37 (1.35%) |
25.69 |
25.16 - 27.39 |
0.7169 times |
DMA SMA EMA moving averages of Halliburton Company HAL
DMA (daily moving average) of Halliburton Company HAL
| DMA period | DMA value | | 5 day DMA | 27.45 | | 12 day DMA | 26.54 | | 20 day DMA | 26.83 | | 35 day DMA | 26.56 | | 50 day DMA | 25.78 | | 100 day DMA | 23.83 | | 150 day DMA | 22.85 | | 200 day DMA | 23.11 | EMA (exponential moving average) of Halliburton Company HAL
| EMA period | EMA current | EMA prev | EMA prev2 | | 5 day EMA | 27.56 | 27.12 | 26.76 | | 12 day EMA | 27.01 | 26.75 | 26.55 | | 20 day EMA | 26.77 | 26.59 | 26.46 | | 35 day EMA | 26.18 | 26.05 | 25.94 | | 50 day EMA | 25.67 | 25.56 | 25.47 |
SMA (simple moving average) of Halliburton Company HAL
| SMA period | SMA current | SMA prev | SMA prev2 | | 5 day SMA | 27.45 | 27 | 26.59 | | 12 day SMA | 26.54 | 26.41 | 26.3 | | 20 day SMA | 26.83 | 26.77 | 26.73 | | 35 day SMA | 26.56 | 26.37 | 26.21 | | 50 day SMA | 25.78 | 25.66 | 25.56 | | 100 day SMA | 23.83 | 23.78 | 23.72 | | 150 day SMA | 22.85 | 22.79 | 22.75 | | 200 day SMA | 23.11 | 23.09 | 23.09 |
|
|
