HaemoneticsCorporation HAE full analysis,charts,indicators,moving averages,SMA,DMA,EMA,ADX,MACD,RSIHaemonetics Corporation HAE WideScreen charts, DMA,SMA,EMA technical analysis, forecast prediction, by indicators ADX,MACD,RSI,CCI NYSE stock exchange
operates under Health Care sector & deals in Medical Dental Instruments
Daily price and charts and targets HaemoneticsCorporation Strong Daily Stock price targets for HaemoneticsCorporation HAE are 50.83 and 51.59 | Daily Target 1 | 50.2 | | Daily Target 2 | 50.69 | | Daily Target 3 | 50.956666666667 | | Daily Target 4 | 51.45 | | Daily Target 5 | 51.72 |
Daily price and volume Haemonetics Corporation
| Date |
Closing |
Open |
Range |
Volume |
Tue 21 October 2025 |
51.19 (0.95%) |
50.58 |
50.46 - 51.22 |
0.649 times |
Mon 20 October 2025 |
50.71 (0.9%) |
50.69 |
49.97 - 51.27 |
0.9393 times |
Fri 17 October 2025 |
50.26 (0.98%) |
49.72 |
49.24 - 50.67 |
1.2396 times |
Thu 16 October 2025 |
49.77 (2.45%) |
48.63 |
48.62 - 50.58 |
1.4381 times |
Wed 15 October 2025 |
48.58 (-2.37%) |
49.55 |
48.55 - 50.02 |
0.9994 times |
Tue 14 October 2025 |
49.76 (-0.96%) |
49.71 |
48.96 - 50.01 |
0.7777 times |
Mon 13 October 2025 |
50.24 (1.99%) |
49.07 |
48.62 - 50.49 |
1.5151 times |
Tue 07 October 2025 |
49.26 (-0.59%) |
49.46 |
48.83 - 50.27 |
0.9254 times |
Mon 06 October 2025 |
49.55 (-1.86%) |
50.49 |
49.51 - 50.60 |
0.4791 times |
Fri 03 October 2025 |
50.49 (3.25%) |
48.91 |
48.82 - 50.50 |
1.0372 times |
Thu 02 October 2025 |
48.90 (0.18%) |
48.65 |
47.75 - 49.00 |
0.6187 times |
Weekly price and charts HaemoneticsCorporation Strong weekly Stock price targets for HaemoneticsCorporation HAE are 50.58 and 51.88 | Weekly Target 1 | 49.51 | | Weekly Target 2 | 50.35 | | Weekly Target 3 | 50.81 | | Weekly Target 4 | 51.65 | | Weekly Target 5 | 52.11 |
Weekly price and volumes for Haemonetics Corporation
| Date |
Closing |
Open |
Range |
Volume |
Tue 21 October 2025 |
51.19 (1.85%) |
50.69 |
49.97 - 51.27 |
0.3166 times |
Fri 17 October 2025 |
50.26 (2.03%) |
49.07 |
48.55 - 50.67 |
1.19 times |
Tue 07 October 2025 |
49.26 (-2.44%) |
50.49 |
48.83 - 50.60 |
0.28 times |
Fri 03 October 2025 |
50.49 (4.82%) |
48.42 |
47.56 - 50.50 |
0.937 times |
Fri 26 September 2025 |
48.17 (-4.8%) |
50.45 |
47.32 - 51.96 |
1.3631 times |
Fri 19 September 2025 |
50.60 (-3.07%) |
52.61 |
49.43 - 52.75 |
2.4588 times |
Fri 12 September 2025 |
52.20 (-4.01%) |
54.15 |
51.87 - 54.52 |
1.383 times |
Fri 05 September 2025 |
54.38 (-0.29%) |
54.50 |
52.58 - 54.80 |
0.8471 times |
Fri 29 August 2025 |
54.54 (0%) |
54.29 |
54.02 - 55.12 |
0.2271 times |
Fri 29 August 2025 |
54.54 (-3.25%) |
56.04 |
53.90 - 56.26 |
0.9973 times |
Fri 22 August 2025 |
56.37 (4.89%) |
53.72 |
53.01 - 56.64 |
1.646 times |
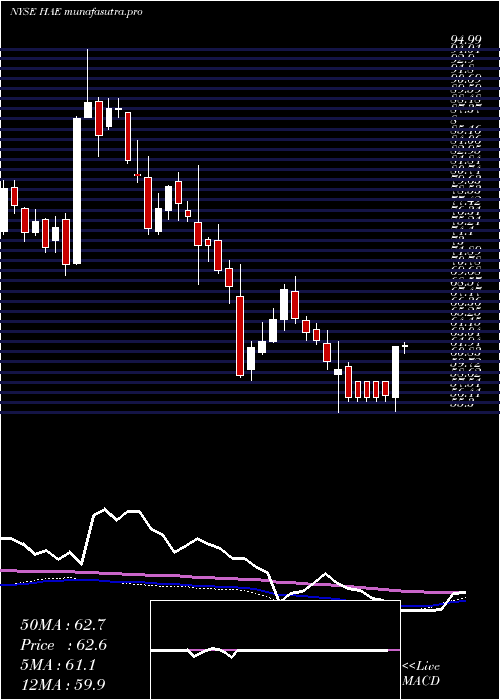
Monthly price and charts HaemoneticsCorporation Strong monthly Stock price targets for HaemoneticsCorporation HAE are 49.46 and 53.01 | Monthly Target 1 | 46.51 | | Monthly Target 2 | 48.85 | | Monthly Target 3 | 50.06 | | Monthly Target 4 | 52.4 | | Monthly Target 5 | 53.61 |
Monthly price and volumes Haemonetics Corporation
| Date |
Closing |
Open |
Range |
Volume |
Tue 21 October 2025 |
51.19 (5.03%) |
48.64 |
47.72 - 51.27 |
0.5156 times |
Tue 30 September 2025 |
48.74 (-10.63%) |
54.50 |
47.32 - 54.80 |
1.4194 times |
Fri 29 August 2025 |
54.54 (-26.34%) |
74.05 |
50.68 - 76.84 |
1.6786 times |
Thu 31 July 2025 |
74.04 (-0.76%) |
73.86 |
72.06 - 79.93 |
0.7313 times |
Mon 30 June 2025 |
74.61 (10.19%) |
67.47 |
67.07 - 75.59 |
0.6347 times |
Fri 30 May 2025 |
67.71 (7.44%) |
63.41 |
61.99 - 70.96 |
0.733 times |
Wed 30 April 2025 |
63.02 (-0.83%) |
63.46 |
55.30 - 64.24 |
0.8736 times |
Mon 31 March 2025 |
63.55 (-2.98%) |
65.50 |
62.03 - 70.13 |
0.9338 times |
Fri 28 February 2025 |
65.50 (-5.14%) |
67.95 |
58.80 - 71.51 |
1.6157 times |
Fri 31 January 2025 |
69.05 (-11.57%) |
78.37 |
67.26 - 82.25 |
0.8641 times |
Tue 31 December 2024 |
78.08 (-11.8%) |
88.03 |
74.70 - 88.03 |
0.4823 times |

DMA SMA EMA moving averages of Haemonetics Corporation HAE
DMA (daily moving average) of Haemonetics Corporation HAE
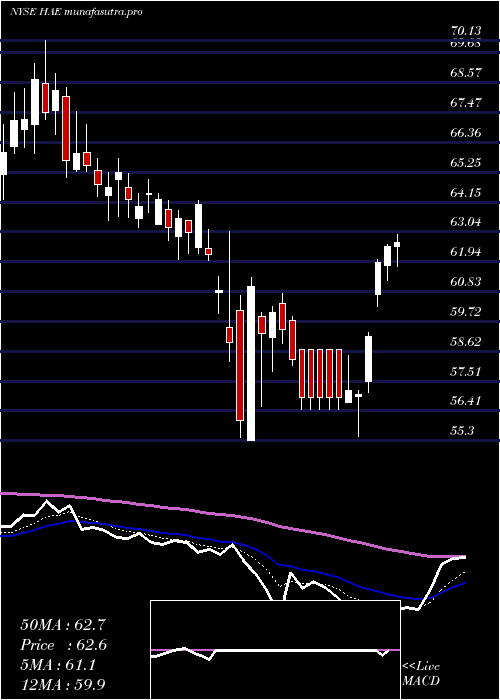
| DMA period | DMA value | | 5 day DMA | 50.1 | | 12 day DMA | 49.79 | | 20 day DMA | 49.66 | | 35 day DMA | 51.11 | | 50 day DMA | 51.99 | | 100 day DMA | 62.32 | | 150 day DMA | 62.56 | | 200 day DMA | 64.22 | EMA (exponential moving average) of Haemonetics Corporation HAE
| EMA period | EMA current | EMA prev | EMA prev2 | | 5 day EMA | 50.44 | 50.06 | 49.74 | | 12 day EMA | 50.06 | 49.86 | 49.71 | | 20 day EMA | 50.36 | 50.27 | 50.22 | | 35 day EMA | 51.75 | 51.78 | 51.84 | | 50 day EMA | 53.39 | 53.48 | 53.59 |
SMA (simple moving average) of Haemonetics Corporation HAE
| SMA period | SMA current | SMA prev | SMA prev2 | | 5 day SMA | 50.1 | 49.82 | 49.72 | | 12 day SMA | 49.79 | 49.59 | 49.37 | | 20 day SMA | 49.66 | 49.66 | 49.62 | | 35 day SMA | 51.11 | 51.2 | 51.32 | | 50 day SMA | 51.99 | 52.08 | 52.58 | | 100 day SMA | 62.32 | 62.47 | 62.63 | | 150 day SMA | 62.56 | 62.65 | 62.75 | | 200 day SMA | 64.22 | 64.36 | 64.49 |
|
|
