WW GWW full analysis,charts,indicators,moving averages,SMA,DMA,EMA,ADX,MACD,RSIW W GWW WideScreen charts, DMA,SMA,EMA technical analysis, forecast prediction, by indicators ADX,MACD,RSI,CCI NYSE stock exchange
operates under Consumer Services sector & deals in Office Equipment Supplies Services
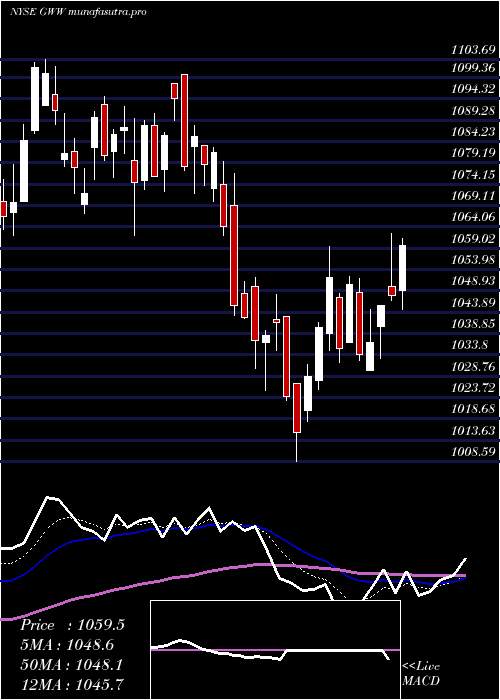
Daily price and charts and targets WW Strong Daily Stock price targets for WW GWW are 968.68 and 984.01 | Daily Target 1 | 956.17 | | Daily Target 2 | 965.85 | | Daily Target 3 | 971.49666666667 | | Daily Target 4 | 981.18 | | Daily Target 5 | 986.83 |
Daily price and volume W W
| Date |
Closing |
Open |
Range |
Volume |
Fri 05 December 2025 |
975.54 (0.68%) |
965.53 |
961.81 - 977.14 |
0.756 times |
Thu 04 December 2025 |
968.91 (-0.23%) |
974.96 |
967.91 - 979.21 |
1.0171 times |
Wed 03 December 2025 |
971.16 (1.04%) |
961.89 |
959.85 - 975.92 |
0.8279 times |
Tue 02 December 2025 |
961.15 (1.72%) |
945.81 |
941.51 - 961.98 |
1.0458 times |
Mon 01 December 2025 |
944.87 (-0.4%) |
941.59 |
941.32 - 955.54 |
1.0182 times |
Fri 28 November 2025 |
948.63 (0.37%) |
944.02 |
942.62 - 949.99 |
0.3875 times |
Wed 26 November 2025 |
945.10 (0.36%) |
938.11 |
933.53 - 949.61 |
0.8032 times |
Tue 25 November 2025 |
941.75 (1.27%) |
937.75 |
932.22 - 945.67 |
0.8432 times |
Mon 24 November 2025 |
929.96 (-2.33%) |
944.23 |
929.70 - 956.00 |
1.7982 times |
Fri 21 November 2025 |
952.15 (2.92%) |
930.88 |
916.11 - 957.69 |
1.503 times |
Thu 20 November 2025 |
925.15 (0.28%) |
930.66 |
920.38 - 937.00 |
1.2727 times |
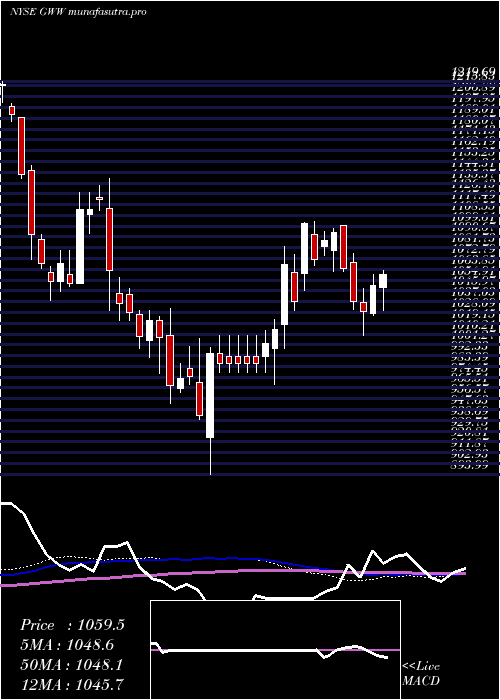
Weekly price and charts WW Strong weekly Stock price targets for WW GWW are 958.43 and 996.32 | Weekly Target 1 | 927.47 | | Weekly Target 2 | 951.5 | | Weekly Target 3 | 965.35666666667 | | Weekly Target 4 | 989.39 | | Weekly Target 5 | 1003.25 |
Weekly price and volumes for W W
| Date |
Closing |
Open |
Range |
Volume |
Fri 05 December 2025 |
975.54 (2.84%) |
941.59 |
941.32 - 979.21 |
1.0108 times |
Fri 28 November 2025 |
948.63 (-0.37%) |
944.23 |
929.70 - 956.00 |
0.8303 times |
Fri 21 November 2025 |
952.15 (2.8%) |
922.13 |
906.52 - 957.69 |
1.2576 times |
Fri 14 November 2025 |
926.21 (-3.02%) |
951.76 |
921.54 - 959.05 |
0.8248 times |
Fri 07 November 2025 |
955.04 (-2.45%) |
965.95 |
945.54 - 970.05 |
0.8613 times |
Fri 31 October 2025 |
979.00 (0%) |
969.02 |
921.16 - 993.06 |
0.6976 times |
Fri 31 October 2025 |
979.00 (1.09%) |
971.24 |
921.16 - 993.06 |
1.7389 times |
Fri 24 October 2025 |
968.41 (1.41%) |
960.38 |
954.84 - 985.56 |
0.9089 times |
Fri 17 October 2025 |
954.99 (0.78%) |
939.87 |
919.16 - 964.02 |
1.0386 times |
Fri 10 October 2025 |
947.56 (-0.94%) |
960.57 |
945.15 - 980.31 |
0.8311 times |
Fri 03 October 2025 |
956.59 (-0.33%) |
960.79 |
937.82 - 969.67 |
0.9547 times |
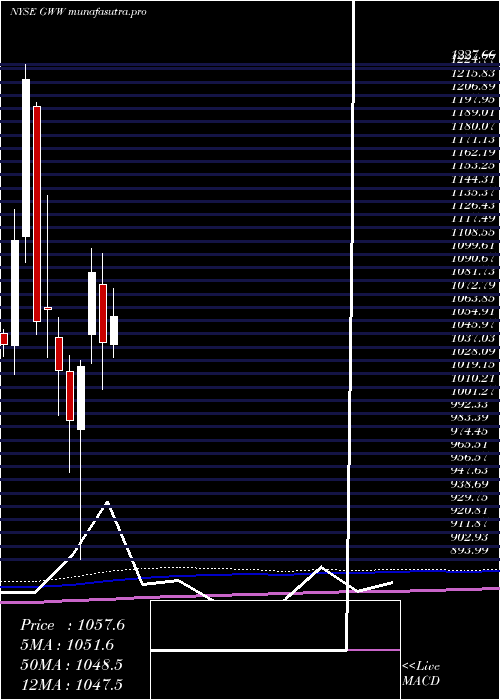
Monthly price and charts WW Strong monthly Stock price targets for WW GWW are 958.43 and 996.32 | Monthly Target 1 | 927.47 | | Monthly Target 2 | 951.5 | | Monthly Target 3 | 965.35666666667 | | Monthly Target 4 | 989.39 | | Monthly Target 5 | 1003.25 |
Monthly price and volumes W W
| Date |
Closing |
Open |
Range |
Volume |
Fri 05 December 2025 |
975.54 (2.84%) |
941.59 |
941.32 - 979.21 |
0.2328 times |
Fri 28 November 2025 |
948.63 (-3.1%) |
965.95 |
906.52 - 970.05 |
0.8693 times |
Fri 31 October 2025 |
979.00 (2.73%) |
946.83 |
919.16 - 993.06 |
1.314 times |
Tue 30 September 2025 |
952.96 (-5.97%) |
1005.49 |
937.82 - 1029.68 |
1.1703 times |
Fri 29 August 2025 |
1013.50 (-2.5%) |
936.18 |
915.86 - 1025.30 |
1.3352 times |
Thu 31 July 2025 |
1039.54 (-0.07%) |
1038.86 |
1011.09 - 1076.78 |
1.2913 times |
Mon 30 June 2025 |
1040.24 (-4.35%) |
1079.60 |
1008.59 - 1100.00 |
0.7886 times |
Fri 30 May 2025 |
1087.56 (6.17%) |
1045.72 |
1025.97 - 1103.69 |
0.9056 times |
Wed 30 April 2025 |
1024.31 (3.69%) |
981.26 |
893.99 - 1028.07 |
1.0905 times |
Mon 31 March 2025 |
987.83 (-3.27%) |
1021.00 |
952.64 - 1031.20 |
1.0022 times |
Fri 28 February 2025 |
1021.21 (-3.9%) |
1043.77 |
990.84 - 1056.76 |
0.9518 times |
DMA SMA EMA moving averages of W W GWW
DMA (daily moving average) of W W GWW
| DMA period | DMA value | | 5 day DMA | 964.33 | | 12 day DMA | 948.91 | | 20 day DMA | 944.27 | | 35 day DMA | 953.4 | | 50 day DMA | 953.86 | | 100 day DMA | 976.78 | | 150 day DMA | 1005.03 | | 200 day DMA | 1000.96 | EMA (exponential moving average) of W W GWW
| EMA period | EMA current | EMA prev | EMA prev2 | | 5 day EMA | 965.59 | 960.62 | 956.47 | | 12 day EMA | 955.21 | 951.51 | 948.35 | | 20 day EMA | 952.14 | 949.68 | 947.66 | | 35 day EMA | 952.01 | 950.62 | 949.54 | | 50 day EMA | 956.28 | 955.49 | 954.94 |
SMA (simple moving average) of W W GWW
| SMA period | SMA current | SMA prev | SMA prev2 | | 5 day SMA | 964.33 | 958.94 | 954.18 | | 12 day SMA | 948.91 | 944.13 | 940.34 | | 20 day SMA | 944.27 | 943.12 | 942.8 | | 35 day SMA | 953.4 | 952.81 | 952.49 | | 50 day SMA | 953.86 | 953.38 | 953.06 | | 100 day SMA | 976.78 | 977.42 | 978.12 | | 150 day SMA | 1005.03 | 1005.55 | 1005.92 | | 200 day SMA | 1000.96 | 1001.12 | 1001.39 |
|
|
