GabelliUtility GUT full analysis,charts,indicators,moving averages,SMA,DMA,EMA,ADX,MACD,RSIGabelli Utility GUT WideScreen charts, DMA,SMA,EMA technical analysis, forecast prediction, by indicators ADX,MACD,RSI,CCI NYSE stock exchange
operates under N A sector & deals in N A
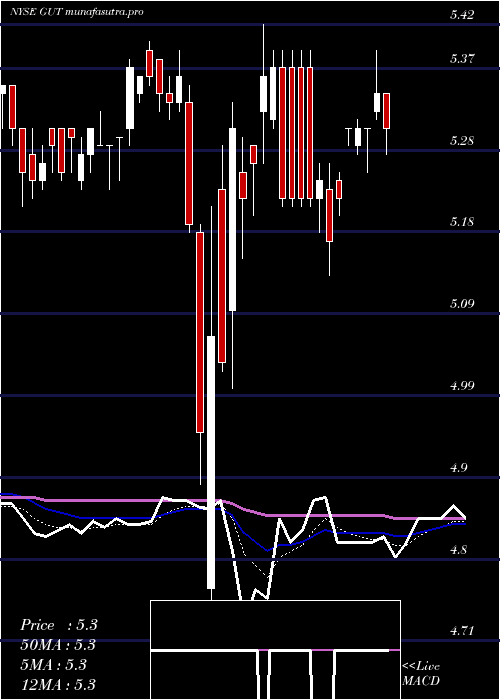
Daily price and charts and targets GabelliUtility Strong Daily Stock price targets for GabelliUtility GUT are 5.98 and 6.08 | Daily Target 1 | 5.95 | | Daily Target 2 | 6 | | Daily Target 3 | 6.05 | | Daily Target 4 | 6.1 | | Daily Target 5 | 6.15 |
Daily price and volume Gabelli Utility
| Date |
Closing |
Open |
Range |
Volume |
Thu 04 December 2025 |
6.05 (-0.49%) |
6.10 |
6.00 - 6.10 |
1.0678 times |
Wed 03 December 2025 |
6.08 (0.5%) |
6.05 |
6.03 - 6.10 |
0.6161 times |
Tue 02 December 2025 |
6.05 (0.5%) |
6.02 |
6.02 - 6.05 |
0.3659 times |
Mon 01 December 2025 |
6.02 (-0.33%) |
6.04 |
6.00 - 6.05 |
0.6055 times |
Fri 28 November 2025 |
6.04 (0.5%) |
6.04 |
6.01 - 6.04 |
0.2758 times |
Wed 26 November 2025 |
6.01 (0.17%) |
6.02 |
6.00 - 6.05 |
0.8833 times |
Tue 25 November 2025 |
6.00 (3.09%) |
5.89 |
5.87 - 6.02 |
0.8699 times |
Mon 24 November 2025 |
5.82 (0.69%) |
5.78 |
5.70 - 5.90 |
1.1335 times |
Fri 21 November 2025 |
5.78 (-4.15%) |
6.01 |
5.42 - 6.04 |
2.9946 times |
Thu 20 November 2025 |
6.03 (1.01%) |
6.06 |
5.95 - 6.06 |
1.1874 times |
Wed 19 November 2025 |
5.97 (-0.17%) |
6.02 |
5.93 - 6.07 |
0.9341 times |
Weekly price and charts GabelliUtility Strong weekly Stock price targets for GabelliUtility GUT are 6.03 and 6.13 | Weekly Target 1 | 5.95 | | Weekly Target 2 | 6 | | Weekly Target 3 | 6.05 | | Weekly Target 4 | 6.1 | | Weekly Target 5 | 6.15 |
Weekly price and volumes for Gabelli Utility
| Date |
Closing |
Open |
Range |
Volume |
Thu 04 December 2025 |
6.05 (0.17%) |
6.04 |
6.00 - 6.10 |
0.7167 times |
Fri 28 November 2025 |
6.04 (4.5%) |
5.78 |
5.70 - 6.05 |
0.8536 times |
Fri 21 November 2025 |
5.78 (-3.99%) |
5.97 |
5.42 - 6.10 |
2.0907 times |
Fri 14 November 2025 |
6.02 (-0.66%) |
6.08 |
6.01 - 6.19 |
1.4988 times |
Fri 07 November 2025 |
6.06 (0.5%) |
6.04 |
6.00 - 6.08 |
0.6567 times |
Fri 31 October 2025 |
6.03 (0%) |
6.06 |
5.96 - 6.06 |
0.1985 times |
Fri 31 October 2025 |
6.03 (-0.17%) |
6.05 |
5.96 - 6.06 |
0.8143 times |
Fri 24 October 2025 |
6.04 (2.37%) |
5.96 |
5.77 - 6.04 |
1.3335 times |
Fri 17 October 2025 |
5.90 (-2.32%) |
6.08 |
5.86 - 6.09 |
1.3372 times |
Tue 07 October 2025 |
6.04 (-0.49%) |
6.04 |
5.94 - 6.07 |
0.4999 times |
Fri 03 October 2025 |
6.07 (0%) |
6.08 |
6.00 - 6.08 |
0.6457 times |

Monthly price and charts GabelliUtility Strong monthly Stock price targets for GabelliUtility GUT are 6.03 and 6.13 | Monthly Target 1 | 5.95 | | Monthly Target 2 | 6 | | Monthly Target 3 | 6.05 | | Monthly Target 4 | 6.1 | | Monthly Target 5 | 6.15 |
Monthly price and volumes Gabelli Utility
| Date |
Closing |
Open |
Range |
Volume |
Thu 04 December 2025 |
6.05 (0.17%) |
6.04 |
6.00 - 6.10 |
0.1687 times |
Fri 28 November 2025 |
6.04 (0.17%) |
6.04 |
5.42 - 6.19 |
1.2004 times |
Fri 31 October 2025 |
6.03 (-0.66%) |
6.00 |
5.77 - 6.09 |
1.0731 times |
Tue 30 September 2025 |
6.07 (2.53%) |
5.85 |
5.83 - 6.10 |
0.8969 times |
Fri 29 August 2025 |
5.92 (-1.66%) |
6.03 |
5.81 - 6.12 |
1.0751 times |
Thu 31 July 2025 |
6.02 (3.79%) |
5.79 |
5.78 - 6.20 |
1.2583 times |
Mon 30 June 2025 |
5.80 (6.03%) |
5.47 |
5.47 - 5.85 |
0.9423 times |
Fri 30 May 2025 |
5.47 (3.21%) |
5.31 |
5.20 - 5.50 |
1.07 times |
Wed 30 April 2025 |
5.30 (-0.75%) |
5.34 |
4.71 - 5.42 |
1.3484 times |
Mon 31 March 2025 |
5.34 (-0.19%) |
5.35 |
5.21 - 5.40 |
0.9669 times |
Fri 28 February 2025 |
5.35 (-2.37%) |
5.45 |
5.32 - 5.50 |
1.0425 times |

DMA SMA EMA moving averages of Gabelli Utility GUT
DMA (daily moving average) of Gabelli Utility GUT
| DMA period | DMA value | | 5 day DMA | 6.05 | | 12 day DMA | 5.99 | | 20 day DMA | 6.03 | | 35 day DMA | 6.01 | | 50 day DMA | 6.02 | | 100 day DMA | 6.02 | | 150 day DMA | 5.86 | | 200 day DMA | 5.72 | EMA (exponential moving average) of Gabelli Utility GUT
| EMA period | EMA current | EMA prev | EMA prev2 | | 5 day EMA | 6.04 | 6.04 | 6.02 | | 12 day EMA | 6.02 | 6.01 | 6 | | 20 day EMA | 6.01 | 6.01 | 6 | | 35 day EMA | 6.01 | 6.01 | 6.01 | | 50 day EMA | 6.01 | 6.01 | 6.01 |
SMA (simple moving average) of Gabelli Utility GUT
| SMA period | SMA current | SMA prev | SMA prev2 | | 5 day SMA | 6.05 | 6.04 | 6.02 | | 12 day SMA | 5.99 | 5.99 | 5.98 | | 20 day SMA | 6.03 | 6.03 | 6.02 | | 35 day SMA | 6.01 | 6.01 | 6.01 | | 50 day SMA | 6.02 | 6.02 | 6.02 | | 100 day SMA | 6.02 | 6.02 | 6.02 | | 150 day SMA | 5.86 | 5.86 | 5.85 | | 200 day SMA | 5.72 | 5.72 | 5.71 |
|
|
