GettyRealty GTY full analysis,charts,indicators,moving averages,SMA,DMA,EMA,ADX,MACD,RSIGetty Realty GTY WideScreen charts, DMA,SMA,EMA technical analysis, forecast prediction, by indicators ADX,MACD,RSI,CCI NYSE stock exchange
operates under Finance sector & deals in Real Estate
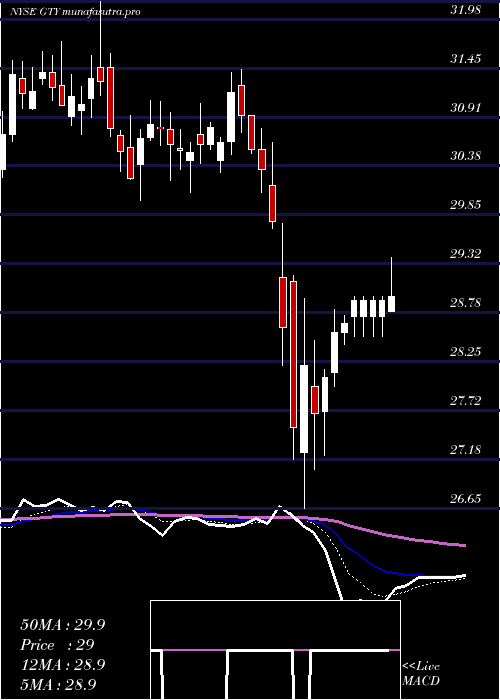
Daily price and charts and targets GettyRealty Strong Daily Stock price targets for GettyRealty GTY are 27.27 and 27.69 | Daily Target 1 | 26.93 | | Daily Target 2 | 27.19 | | Daily Target 3 | 27.35 | | Daily Target 4 | 27.61 | | Daily Target 5 | 27.77 |
Daily price and volume Getty Realty
| Date |
Closing |
Open |
Range |
Volume |
Mon 20 October 2025 |
27.45 (1.03%) |
27.26 |
27.09 - 27.51 |
0.7594 times |
Fri 17 October 2025 |
27.17 (1.19%) |
26.79 |
26.79 - 27.32 |
1.0759 times |
Thu 16 October 2025 |
26.85 (2.29%) |
26.44 |
26.44 - 26.95 |
1.5791 times |
Wed 15 October 2025 |
26.25 (1.43%) |
25.85 |
25.85 - 26.41 |
1.2893 times |
Tue 14 October 2025 |
25.88 (1.05%) |
25.65 |
25.53 - 25.90 |
0.8693 times |
Mon 13 October 2025 |
25.61 (-2.51%) |
25.73 |
25.39 - 25.91 |
0.8663 times |
Tue 07 October 2025 |
26.27 (0.15%) |
26.27 |
26.09 - 26.46 |
0.8839 times |
Mon 06 October 2025 |
26.23 (-1.8%) |
26.58 |
26.19 - 26.82 |
0.7798 times |
Fri 03 October 2025 |
26.71 (-1.55%) |
26.80 |
26.71 - 27.25 |
1.1723 times |
Thu 02 October 2025 |
27.13 (0.37%) |
26.96 |
26.65 - 27.13 |
0.7247 times |
Wed 01 October 2025 |
27.03 (0.75%) |
26.58 |
26.58 - 27.18 |
1.1645 times |
Weekly price and charts GettyRealty Strong weekly Stock price targets for GettyRealty GTY are 27.27 and 27.69 | Weekly Target 1 | 26.93 | | Weekly Target 2 | 27.19 | | Weekly Target 3 | 27.35 | | Weekly Target 4 | 27.61 | | Weekly Target 5 | 27.77 |
Weekly price and volumes for Getty Realty
| Date |
Closing |
Open |
Range |
Volume |
Mon 20 October 2025 |
27.45 (1.03%) |
27.26 |
27.09 - 27.51 |
0.1953 times |
Fri 17 October 2025 |
27.17 (3.43%) |
25.73 |
25.39 - 27.32 |
1.4606 times |
Tue 07 October 2025 |
26.27 (-1.65%) |
26.58 |
26.09 - 26.82 |
0.4278 times |
Fri 03 October 2025 |
26.71 (0.04%) |
26.77 |
26.35 - 27.25 |
1.3485 times |
Fri 26 September 2025 |
26.70 (-2.52%) |
27.48 |
26.35 - 27.48 |
1.328 times |
Fri 19 September 2025 |
27.39 (-3.01%) |
28.38 |
27.38 - 28.39 |
1.5827 times |
Fri 12 September 2025 |
28.24 (-2.18%) |
28.59 |
28.02 - 28.73 |
1.2191 times |
Fri 05 September 2025 |
28.87 (0.98%) |
28.49 |
28.05 - 28.96 |
1.014 times |
Fri 29 August 2025 |
28.59 (0%) |
28.51 |
28.48 - 28.62 |
0.2384 times |
Fri 29 August 2025 |
28.59 (-0.87%) |
28.72 |
28.08 - 28.94 |
1.1855 times |
Fri 22 August 2025 |
28.84 (2.31%) |
28.15 |
27.82 - 29.16 |
1.3877 times |
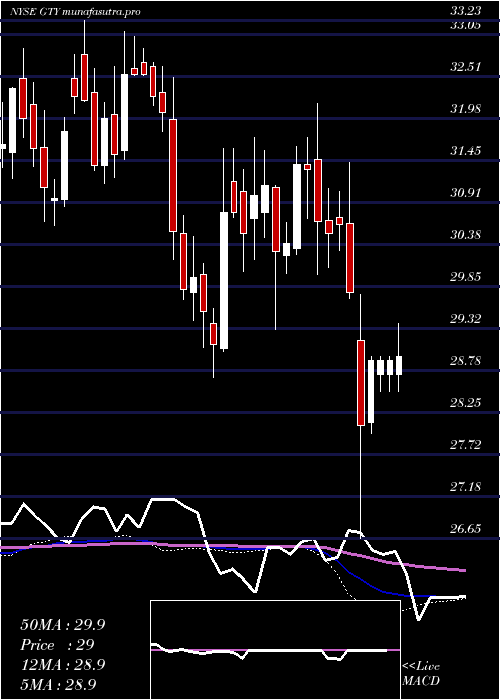
Monthly price and charts GettyRealty Strong monthly Stock price targets for GettyRealty GTY are 26.42 and 28.54 | Monthly Target 1 | 24.66 | | Monthly Target 2 | 26.06 | | Monthly Target 3 | 26.783333333333 | | Monthly Target 4 | 28.18 | | Monthly Target 5 | 28.9 |
Monthly price and volumes Getty Realty
| Date |
Closing |
Open |
Range |
Volume |
Mon 20 October 2025 |
27.45 (2.31%) |
26.58 |
25.39 - 27.51 |
0.4735 times |
Tue 30 September 2025 |
26.83 (-6.16%) |
28.49 |
26.35 - 28.96 |
0.9409 times |
Fri 29 August 2025 |
28.59 (2.88%) |
28.01 |
27.79 - 29.16 |
0.9502 times |
Thu 31 July 2025 |
27.79 (0.54%) |
27.65 |
26.42 - 28.55 |
1.3557 times |
Mon 30 June 2025 |
27.64 (-5.54%) |
29.04 |
27.12 - 29.72 |
0.9983 times |
Fri 30 May 2025 |
29.26 (4.54%) |
27.99 |
27.56 - 29.39 |
0.988 times |
Wed 30 April 2025 |
27.99 (-10.23%) |
31.26 |
26.65 - 31.43 |
1.3221 times |
Mon 31 March 2025 |
31.18 (-0.7%) |
31.40 |
30.00 - 32.17 |
0.9846 times |
Fri 28 February 2025 |
31.40 (1.26%) |
30.79 |
29.30 - 31.63 |
0.916 times |
Fri 31 January 2025 |
31.01 (2.92%) |
30.08 |
28.70 - 31.75 |
1.0707 times |
Tue 31 December 2024 |
30.13 (-7.43%) |
32.65 |
29.42 - 32.70 |
0.7045 times |

DMA SMA EMA moving averages of Getty Realty GTY
DMA (daily moving average) of Getty Realty GTY
| DMA period | DMA value | | 5 day DMA | 26.72 | | 12 day DMA | 26.62 | | 20 day DMA | 26.79 | | 35 day DMA | 27.47 | | 50 day DMA | 27.74 | | 100 day DMA | 27.98 | | 150 day DMA | 28.35 | | 200 day DMA | 28.91 | EMA (exponential moving average) of Getty Realty GTY
| EMA period | EMA current | EMA prev | EMA prev2 | | 5 day EMA | 26.92 | 26.65 | 26.39 | | 12 day EMA | 26.77 | 26.65 | 26.55 | | 20 day EMA | 26.91 | 26.85 | 26.82 | | 35 day EMA | 27.25 | 27.24 | 27.24 | | 50 day EMA | 27.68 | 27.69 | 27.71 |
SMA (simple moving average) of Getty Realty GTY
| SMA period | SMA current | SMA prev | SMA prev2 | | 5 day SMA | 26.72 | 26.35 | 26.17 | | 12 day SMA | 26.62 | 26.53 | 26.5 | | 20 day SMA | 26.79 | 26.8 | 26.83 | | 35 day SMA | 27.47 | 27.5 | 27.53 | | 50 day SMA | 27.74 | 27.76 | 27.78 | | 100 day SMA | 27.98 | 27.99 | 28.01 | | 150 day SMA | 28.35 | 28.37 | 28.4 | | 200 day SMA | 28.91 | 28.93 | 28.94 |
|
|
