GrayTelevision GTN full analysis,charts,indicators,moving averages,SMA,DMA,EMA,ADX,MACD,RSIGray Television GTN WideScreen charts, DMA,SMA,EMA technical analysis, forecast prediction, by indicators ADX,MACD,RSI,CCI NYSE stock exchange
operates under Consumer Services sector & deals in Broadcasting
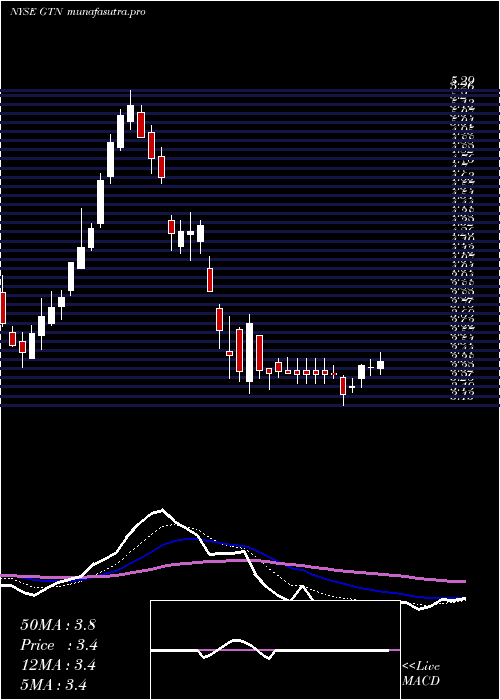
Daily price and charts and targets GrayTelevision Strong Daily Stock price targets for GrayTelevision GTN are 4.73 and 4.89 | Daily Target 1 | 4.6 | | Daily Target 2 | 4.69 | | Daily Target 3 | 4.7566666666667 | | Daily Target 4 | 4.85 | | Daily Target 5 | 4.92 |
Daily price and volume Gray Television
| Date |
Closing |
Open |
Range |
Volume |
Mon 20 October 2025 |
4.79 (2.57%) |
4.67 |
4.66 - 4.82 |
0.8855 times |
Fri 17 October 2025 |
4.67 (1.08%) |
4.62 |
4.61 - 4.75 |
0.904 times |
Thu 16 October 2025 |
4.62 (-2.74%) |
4.79 |
4.57 - 4.81 |
1.0559 times |
Wed 15 October 2025 |
4.75 (-1.86%) |
4.90 |
4.69 - 4.97 |
0.8797 times |
Tue 14 October 2025 |
4.84 (2.11%) |
4.66 |
4.60 - 4.85 |
1.0098 times |
Mon 13 October 2025 |
4.74 (-14.59%) |
4.73 |
4.63 - 4.85 |
1.1752 times |
Tue 07 October 2025 |
5.55 (0.18%) |
5.65 |
5.48 - 5.68 |
1.1839 times |
Mon 06 October 2025 |
5.54 (-2.12%) |
5.71 |
5.51 - 5.72 |
1.3803 times |
Fri 03 October 2025 |
5.66 (-0.7%) |
5.72 |
5.64 - 5.86 |
0.7929 times |
Thu 02 October 2025 |
5.70 (1.42%) |
5.59 |
5.59 - 5.75 |
0.7328 times |
Wed 01 October 2025 |
5.62 (-2.77%) |
5.71 |
5.59 - 5.82 |
1.1503 times |
Weekly price and charts GrayTelevision Strong weekly Stock price targets for GrayTelevision GTN are 4.73 and 4.89 | Weekly Target 1 | 4.6 | | Weekly Target 2 | 4.69 | | Weekly Target 3 | 4.7566666666667 | | Weekly Target 4 | 4.85 | | Weekly Target 5 | 4.92 |
Weekly price and volumes for Gray Television
| Date |
Closing |
Open |
Range |
Volume |
Mon 20 October 2025 |
4.79 (2.57%) |
4.67 |
4.66 - 4.82 |
0.2004 times |
Fri 17 October 2025 |
4.67 (-15.86%) |
4.73 |
4.57 - 4.97 |
1.1371 times |
Tue 07 October 2025 |
5.55 (-1.94%) |
5.71 |
5.48 - 5.72 |
0.5803 times |
Fri 03 October 2025 |
5.66 (-2.41%) |
5.83 |
5.59 - 5.94 |
1.1676 times |
Fri 26 September 2025 |
5.80 (5.07%) |
5.46 |
5.46 - 6.00 |
1.3775 times |
Fri 19 September 2025 |
5.52 (-5.8%) |
5.82 |
5.39 - 5.83 |
1.5728 times |
Fri 12 September 2025 |
5.86 (-4.25%) |
6.17 |
5.57 - 6.24 |
1.4888 times |
Fri 05 September 2025 |
6.12 (-0.16%) |
6.02 |
5.80 - 6.29 |
0.9034 times |
Fri 29 August 2025 |
6.13 (0%) |
6.06 |
6.00 - 6.17 |
0.2096 times |
Fri 29 August 2025 |
6.13 (0.99%) |
6.00 |
5.93 - 6.31 |
1.3624 times |
Fri 22 August 2025 |
6.07 (3.23%) |
5.82 |
5.61 - 6.10 |
1.3673 times |
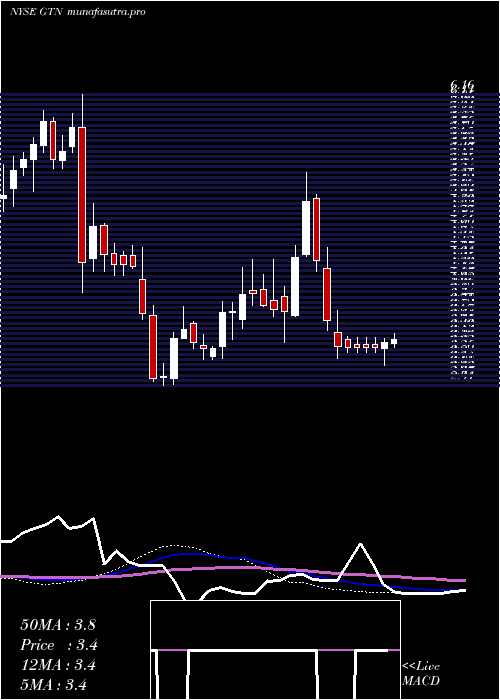
Monthly price and charts GrayTelevision Strong monthly Stock price targets for GrayTelevision GTN are 4.04 and 5.33 | Monthly Target 1 | 3.78 | | Monthly Target 2 | 4.29 | | Monthly Target 3 | 5.0733333333333 | | Monthly Target 4 | 5.58 | | Monthly Target 5 | 6.36 |
Monthly price and volumes Gray Television
| Date |
Closing |
Open |
Range |
Volume |
Mon 20 October 2025 |
4.79 (-17.13%) |
5.71 |
4.57 - 5.86 |
0.3784 times |
Tue 30 September 2025 |
5.78 (-5.71%) |
6.02 |
5.39 - 6.29 |
0.8854 times |
Fri 29 August 2025 |
6.13 (35.92%) |
4.45 |
3.50 - 6.31 |
1.2782 times |
Thu 31 July 2025 |
4.51 (-0.44%) |
4.52 |
4.43 - 5.70 |
1.2292 times |
Mon 30 June 2025 |
4.53 (14.11%) |
3.95 |
3.62 - 4.67 |
0.8746 times |
Fri 30 May 2025 |
3.97 (18.51%) |
3.36 |
3.27 - 4.77 |
1.1628 times |
Wed 30 April 2025 |
3.35 (-22.45%) |
4.30 |
3.13 - 4.45 |
0.8825 times |
Mon 31 March 2025 |
4.32 (14.89%) |
3.90 |
3.39 - 5.29 |
1.3528 times |
Fri 28 February 2025 |
3.76 (0.53%) |
3.65 |
3.55 - 4.32 |
1.0753 times |
Fri 31 January 2025 |
3.74 (18.73%) |
3.18 |
3.15 - 3.85 |
0.8807 times |
Tue 31 December 2024 |
3.15 (-26.06%) |
4.36 |
2.91 - 4.48 |
1.03 times |

DMA SMA EMA moving averages of Gray Television GTN
DMA (daily moving average) of Gray Television GTN
| DMA period | DMA value | | 5 day DMA | 4.73 | | 12 day DMA | 5.19 | | 20 day DMA | 5.39 | | 35 day DMA | 5.61 | | 50 day DMA | 5.61 | | 100 day DMA | 5.08 | | 150 day DMA | 4.69 | | 200 day DMA | 4.44 | EMA (exponential moving average) of Gray Television GTN
| EMA period | EMA current | EMA prev | EMA prev2 | | 5 day EMA | 4.81 | 4.82 | 4.89 | | 12 day EMA | 5.08 | 5.13 | 5.21 | | 20 day EMA | 5.25 | 5.3 | 5.37 | | 35 day EMA | 5.38 | 5.41 | 5.45 | | 50 day EMA | 5.43 | 5.46 | 5.49 |
SMA (simple moving average) of Gray Television GTN
| SMA period | SMA current | SMA prev | SMA prev2 | | 5 day SMA | 4.73 | 4.72 | 4.9 | | 12 day SMA | 5.19 | 5.26 | 5.36 | | 20 day SMA | 5.39 | 5.42 | 5.47 | | 35 day SMA | 5.61 | 5.65 | 5.69 | | 50 day SMA | 5.61 | 5.61 | 5.6 | | 100 day SMA | 5.08 | 5.07 | 5.06 | | 150 day SMA | 4.69 | 4.69 | 4.68 | | 200 day SMA | 4.44 | 4.43 | 4.42 |
|
|
