GatesIndustrial GTES full analysis,charts,indicators,moving averages,SMA,DMA,EMA,ADX,MACD,RSIGates Industrial GTES WideScreen charts, DMA,SMA,EMA technical analysis, forecast prediction, by indicators ADX,MACD,RSI,CCI NYSE stock exchange
operates under Technology sector & deals in Industrial Machinery Components
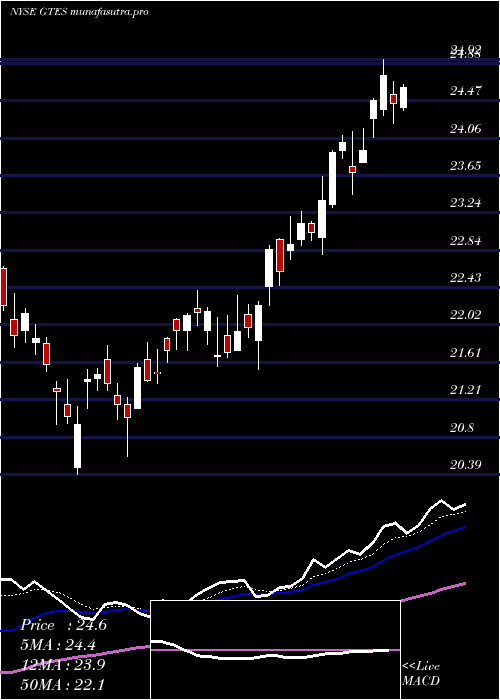
Daily price and charts and targets GatesIndustrial Strong Daily Stock price targets for GatesIndustrial GTES are 25.81 and 26.13 | Daily Target 1 | 25.74 | | Daily Target 2 | 25.87 | | Daily Target 3 | 26.063333333333 | | Daily Target 4 | 26.19 | | Daily Target 5 | 26.38 |
Daily price and volume Gates Industrial
| Date |
Closing |
Open |
Range |
Volume |
Mon 20 October 2025 |
25.99 (0.23%) |
26.03 |
25.94 - 26.26 |
0.5978 times |
Fri 17 October 2025 |
25.93 (0.19%) |
25.64 |
25.51 - 25.95 |
0.9421 times |
Thu 16 October 2025 |
25.88 (0.5%) |
25.99 |
25.69 - 26.23 |
1.6409 times |
Wed 15 October 2025 |
25.75 (3.37%) |
25.25 |
25.12 - 25.86 |
1.8955 times |
Tue 14 October 2025 |
24.91 (1.3%) |
24.17 |
24.05 - 25.23 |
0.7873 times |
Mon 13 October 2025 |
24.59 (-3.15%) |
24.98 |
24.55 - 25.41 |
0.8311 times |
Tue 07 October 2025 |
25.39 (-0.47%) |
25.65 |
25.24 - 25.68 |
0.8144 times |
Mon 06 October 2025 |
25.51 (-0.89%) |
25.99 |
25.51 - 26.03 |
0.8376 times |
Fri 03 October 2025 |
25.74 (-0.04%) |
25.83 |
25.68 - 26.13 |
0.9619 times |
Thu 02 October 2025 |
25.75 (2.14%) |
25.21 |
25.21 - 25.83 |
0.6912 times |
Wed 01 October 2025 |
25.21 (1.57%) |
24.53 |
24.53 - 25.33 |
0.9397 times |
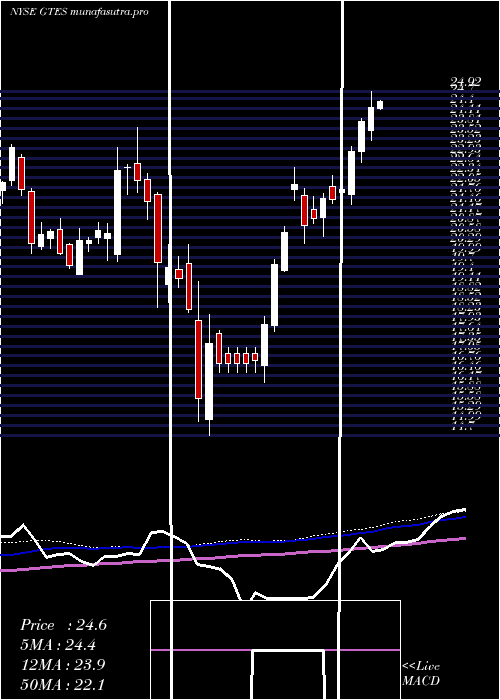
Weekly price and charts GatesIndustrial Strong weekly Stock price targets for GatesIndustrial GTES are 25.81 and 26.13 | Weekly Target 1 | 25.74 | | Weekly Target 2 | 25.87 | | Weekly Target 3 | 26.063333333333 | | Weekly Target 4 | 26.19 | | Weekly Target 5 | 26.38 |
Weekly price and volumes for Gates Industrial
| Date |
Closing |
Open |
Range |
Volume |
Mon 20 October 2025 |
25.99 (0.23%) |
26.03 |
25.94 - 26.26 |
0.1359 times |
Fri 17 October 2025 |
25.93 (2.13%) |
24.98 |
24.05 - 26.23 |
1.386 times |
Tue 07 October 2025 |
25.39 (-1.36%) |
25.99 |
25.24 - 26.03 |
0.3755 times |
Fri 03 October 2025 |
25.74 (3.37%) |
25.09 |
24.53 - 26.13 |
1.0126 times |
Fri 26 September 2025 |
24.90 (-1.54%) |
25.18 |
23.86 - 26.09 |
1.3677 times |
Fri 19 September 2025 |
25.29 (-1.29%) |
25.63 |
24.92 - 26.03 |
2.0928 times |
Fri 12 September 2025 |
25.62 (-1.2%) |
26.00 |
25.10 - 26.18 |
1.2322 times |
Fri 05 September 2025 |
25.93 (1.45%) |
25.12 |
24.77 - 26.42 |
1.113 times |
Fri 29 August 2025 |
25.56 (0%) |
26.14 |
25.40 - 26.19 |
0.1895 times |
Fri 29 August 2025 |
25.56 (1.31%) |
25.60 |
25.40 - 26.33 |
1.0948 times |
Fri 22 August 2025 |
25.23 (4.69%) |
24.04 |
23.90 - 25.43 |
1.0288 times |
Monthly price and charts GatesIndustrial Strong monthly Stock price targets for GatesIndustrial GTES are 25.02 and 27.23 | Monthly Target 1 | 23.22 | | Monthly Target 2 | 24.61 | | Monthly Target 3 | 25.433333333333 | | Monthly Target 4 | 26.82 | | Monthly Target 5 | 27.64 |
Monthly price and volumes Gates Industrial
| Date |
Closing |
Open |
Range |
Volume |
Mon 20 October 2025 |
25.99 (4.71%) |
24.53 |
24.05 - 26.26 |
0.4475 times |
Tue 30 September 2025 |
24.82 (-2.9%) |
25.12 |
23.86 - 26.42 |
1.1209 times |
Fri 29 August 2025 |
25.56 (3.06%) |
24.19 |
23.51 - 26.33 |
0.8469 times |
Thu 31 July 2025 |
24.80 (7.69%) |
22.98 |
22.79 - 25.66 |
0.9465 times |
Mon 30 June 2025 |
23.03 (8.89%) |
21.16 |
20.59 - 23.26 |
0.7066 times |
Fri 30 May 2025 |
21.15 (11.79%) |
19.07 |
18.99 - 22.66 |
0.9287 times |
Wed 30 April 2025 |
18.92 (2.77%) |
18.28 |
14.70 - 19.27 |
1.3396 times |
Mon 31 March 2025 |
18.41 (-14.93%) |
21.86 |
17.72 - 21.92 |
1.4423 times |
Fri 28 February 2025 |
21.64 (4.59%) |
20.07 |
19.87 - 23.85 |
1.1923 times |
Fri 31 January 2025 |
20.69 (0.58%) |
20.69 |
19.48 - 21.14 |
1.0287 times |
Tue 31 December 2024 |
20.57 (-7.38%) |
22.25 |
20.10 - 23.34 |
0.8341 times |
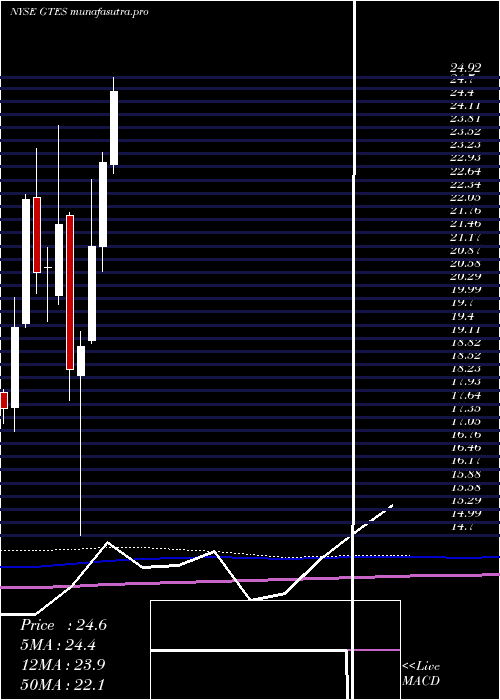
DMA SMA EMA moving averages of Gates Industrial GTES
DMA (daily moving average) of Gates Industrial GTES
| DMA period | DMA value | | 5 day DMA | 25.69 | | 12 day DMA | 25.46 | | 20 day DMA | 25.31 | | 35 day DMA | 25.41 | | 50 day DMA | 25.18 | | 100 day DMA | 24.18 | | 150 day DMA | 22.41 | | 200 day DMA | 22.04 | EMA (exponential moving average) of Gates Industrial GTES
| EMA period | EMA current | EMA prev | EMA prev2 | | 5 day EMA | 25.76 | 25.64 | 25.49 | | 12 day EMA | 25.52 | 25.44 | 25.35 | | 20 day EMA | 25.41 | 25.35 | 25.29 | | 35 day EMA | 25.26 | 25.22 | 25.18 | | 50 day EMA | 25.17 | 25.14 | 25.11 |
SMA (simple moving average) of Gates Industrial GTES
| SMA period | SMA current | SMA prev | SMA prev2 | | 5 day SMA | 25.69 | 25.41 | 25.3 | | 12 day SMA | 25.46 | 25.36 | 25.27 | | 20 day SMA | 25.31 | 25.27 | 25.23 | | 35 day SMA | 25.41 | 25.41 | 25.41 | | 50 day SMA | 25.18 | 25.14 | 25.11 | | 100 day SMA | 24.18 | 24.14 | 24.09 | | 150 day SMA | 22.41 | 22.37 | 22.32 | | 200 day SMA | 22.04 | 22.01 | 21.99 |
|
|
