GlaxosmithklinePlc GSK full analysis,charts,indicators,moving averages,SMA,DMA,EMA,ADX,MACD,RSIGlaxosmithkline Plc GSK WideScreen charts, DMA,SMA,EMA technical analysis, forecast prediction, by indicators ADX,MACD,RSI,CCI NYSE stock exchange
operates under Health Care sector & deals in Major Pharmaceuticals
Daily price and charts and targets GlaxosmithklinePlc Strong Daily Stock price targets for GlaxosmithklinePlc GSK are 48.01 and 49.1 | Daily Target 1 | 47.82 | | Daily Target 2 | 48.2 | | Daily Target 3 | 48.91 | | Daily Target 4 | 49.29 | | Daily Target 5 | 50 |
Daily price and volume Glaxosmithkline Plc
| Date |
Closing |
Open |
Range |
Volume |
Thu 04 December 2025 |
48.58 (-0.8%) |
49.05 |
48.53 - 49.62 |
0.5135 times |
Wed 03 December 2025 |
48.97 (1.45%) |
48.95 |
48.80 - 49.31 |
0.8613 times |
Tue 02 December 2025 |
48.27 (2.29%) |
48.09 |
47.78 - 48.40 |
1.128 times |
Mon 01 December 2025 |
47.19 (-1.4%) |
48.06 |
47.13 - 48.08 |
0.8536 times |
Fri 28 November 2025 |
47.86 (-0.33%) |
47.88 |
47.42 - 47.90 |
0.6645 times |
Wed 26 November 2025 |
48.02 (0.99%) |
47.81 |
47.66 - 48.36 |
0.7706 times |
Tue 25 November 2025 |
47.55 (1.19%) |
47.35 |
47.31 - 47.92 |
1.5384 times |
Mon 24 November 2025 |
46.99 (-0.42%) |
47.03 |
46.86 - 47.34 |
1.2364 times |
Fri 21 November 2025 |
47.19 (2.34%) |
46.49 |
46.47 - 47.32 |
0.9869 times |
Thu 20 November 2025 |
46.11 (-0.5%) |
46.60 |
45.81 - 46.60 |
1.4467 times |
Wed 19 November 2025 |
46.34 (-2.17%) |
47.02 |
46.32 - 47.08 |
1.4478 times |
Weekly price and charts GlaxosmithklinePlc Strong weekly Stock price targets for GlaxosmithklinePlc GSK are 47.86 and 50.35 | Weekly Target 1 | 45.95 | | Weekly Target 2 | 47.27 | | Weekly Target 3 | 48.443333333333 | | Weekly Target 4 | 49.76 | | Weekly Target 5 | 50.93 |
Weekly price and volumes for Glaxosmithkline Plc
| Date |
Closing |
Open |
Range |
Volume |
Thu 04 December 2025 |
48.58 (1.5%) |
48.06 |
47.13 - 49.62 |
0.7369 times |
Fri 28 November 2025 |
47.86 (1.42%) |
47.03 |
46.86 - 48.36 |
0.9243 times |
Fri 21 November 2025 |
47.19 (0.02%) |
47.60 |
45.81 - 47.98 |
1.2803 times |
Fri 14 November 2025 |
47.18 (1.18%) |
46.75 |
46.56 - 48.69 |
0.9942 times |
Fri 07 November 2025 |
46.63 (-0.49%) |
46.29 |
45.81 - 47.21 |
0.9276 times |
Fri 31 October 2025 |
46.86 (0%) |
46.85 |
46.57 - 47.12 |
0.2572 times |
Fri 31 October 2025 |
46.86 (8.37%) |
43.85 |
42.89 - 47.16 |
2.1312 times |
Fri 24 October 2025 |
43.24 (-1.53%) |
43.88 |
42.85 - 46.87 |
1.3325 times |
Fri 17 October 2025 |
43.91 (0.94%) |
43.24 |
43.21 - 44.35 |
0.9251 times |
Tue 07 October 2025 |
43.50 (0.35%) |
43.42 |
43.09 - 44.02 |
0.4907 times |
Fri 03 October 2025 |
43.35 (8.78%) |
40.49 |
40.36 - 45.59 |
2.9726 times |
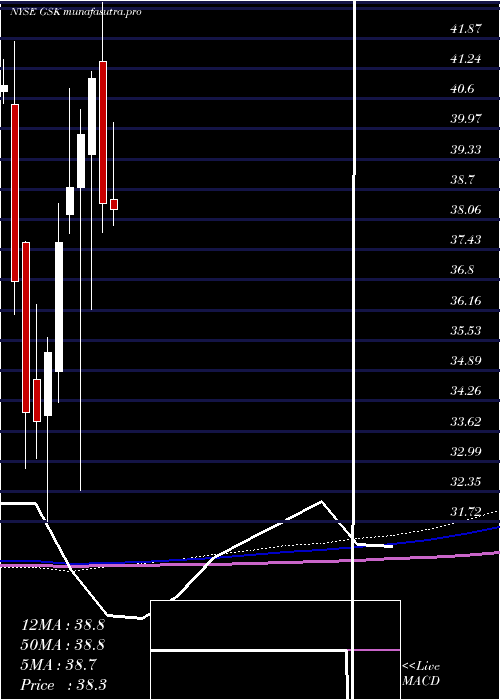
Monthly price and charts GlaxosmithklinePlc Strong monthly Stock price targets for GlaxosmithklinePlc GSK are 47.86 and 50.35 | Monthly Target 1 | 45.95 | | Monthly Target 2 | 47.27 | | Monthly Target 3 | 48.443333333333 | | Monthly Target 4 | 49.76 | | Monthly Target 5 | 50.93 |
Monthly price and volumes Glaxosmithkline Plc
| Date |
Closing |
Open |
Range |
Volume |
Thu 04 December 2025 |
48.58 (1.5%) |
48.06 |
47.13 - 49.62 |
0.151 times |
Fri 28 November 2025 |
47.86 (2.13%) |
46.29 |
45.81 - 48.69 |
0.8455 times |
Fri 31 October 2025 |
46.86 (8.57%) |
44.22 |
42.85 - 47.16 |
1.4628 times |
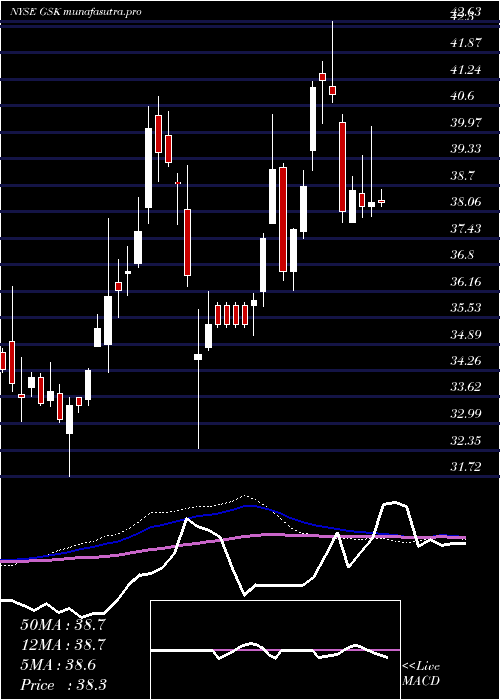
Tue 30 September 2025 |
43.16 (8.8%) |
39.16 |
38.63 - 43.32 |
0.99 times |
Fri 29 August 2025 |
39.67 (6.78%) |
37.68 |
36.75 - 40.57 |
0.7078 times |
Thu 31 July 2025 |
37.15 (-3.26%) |
38.48 |
35.45 - 40.11 |
1.4316 times |
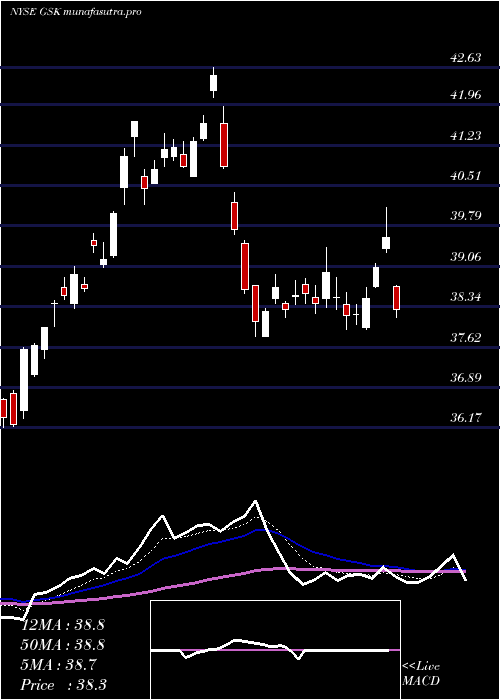
Mon 30 June 2025 |
38.40 (-6.41%) |
41.38 |
37.80 - 42.63 |
0.9851 times |
Fri 30 May 2025 |
41.03 (2.96%) |
39.42 |
36.17 - 41.17 |
1.1254 times |
Wed 30 April 2025 |
39.85 (2.87%) |
38.73 |
32.38 - 40.38 |
1.3327 times |
Mon 31 March 2025 |
38.74 (3.06%) |
38.17 |
37.76 - 40.81 |
0.9682 times |
Fri 28 February 2025 |
37.59 (6.58%) |
34.87 |
34.22 - 38.40 |
1.1466 times |
DMA SMA EMA moving averages of Glaxosmithkline Plc GSK
DMA (daily moving average) of Glaxosmithkline Plc GSK
| DMA period | DMA value | | 5 day DMA | 48.17 | | 12 day DMA | 47.54 | | 20 day DMA | 47.54 | | 35 day DMA | 46.53 | | 50 day DMA | 45.3 | | 100 day DMA | 42.11 | | 150 day DMA | 41.07 | | 200 day DMA | 40.15 | EMA (exponential moving average) of Glaxosmithkline Plc GSK
| EMA period | EMA current | EMA prev | EMA prev2 | | 5 day EMA | 48.29 | 48.14 | 47.72 | | 12 day EMA | 47.8 | 47.66 | 47.42 | | 20 day EMA | 47.34 | 47.21 | 47.02 | | 35 day EMA | 46.27 | 46.13 | 45.96 | | 50 day EMA | 45.18 | 45.04 | 44.88 |
SMA (simple moving average) of Glaxosmithkline Plc GSK
| SMA period | SMA current | SMA prev | SMA prev2 | | 5 day SMA | 48.17 | 48.06 | 47.78 | | 12 day SMA | 47.54 | 47.45 | 47.3 | | 20 day SMA | 47.54 | 47.45 | 47.34 | | 35 day SMA | 46.53 | 46.39 | 46.26 | | 50 day SMA | 45.3 | 45.14 | 44.97 | | 100 day SMA | 42.11 | 42.02 | 41.92 | | 150 day SMA | 41.07 | 40.99 | 40.92 | | 200 day SMA | 40.15 | 40.09 | 40.02 |
|
|
