GoldmanSachs GSBD full analysis,charts,indicators,moving averages,SMA,DMA,EMA,ADX,MACD,RSIGoldman Sachs GSBD WideScreen charts, DMA,SMA,EMA technical analysis, forecast prediction, by indicators ADX,MACD,RSI,CCI NYSE stock exchange
operates under N A sector & deals in N A
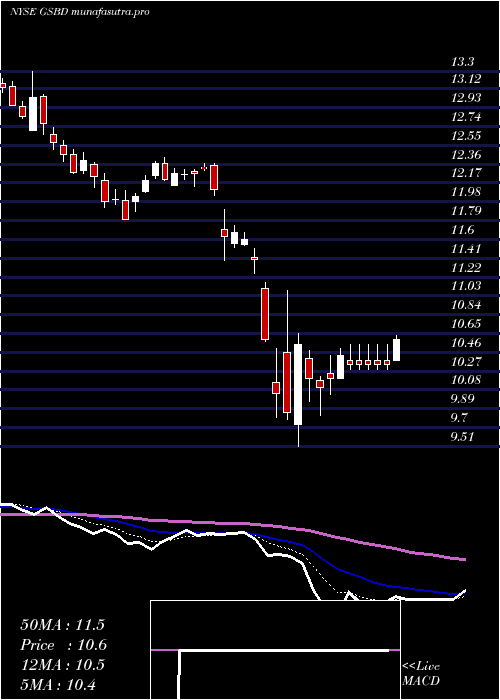
Daily price and charts and targets GoldmanSachs Strong Daily Stock price targets for GoldmanSachs GSBD are 10.1 and 10.27 | Daily Target 1 | 9.98 | | Daily Target 2 | 10.05 | | Daily Target 3 | 10.15 | | Daily Target 4 | 10.22 | | Daily Target 5 | 10.32 |
Daily price and volume Goldman Sachs
| Date |
Closing |
Open |
Range |
Volume |
Thu 04 December 2025 |
10.12 (0.4%) |
10.10 |
10.08 - 10.25 |
0.9954 times |
Wed 03 December 2025 |
10.08 (1.82%) |
9.96 |
9.95 - 10.14 |
0.9757 times |
Tue 02 December 2025 |
9.90 (-0.3%) |
9.93 |
9.81 - 9.96 |
0.584 times |
Mon 01 December 2025 |
9.93 (-0.8%) |
9.93 |
9.86 - 10.03 |
1.3438 times |
Fri 28 November 2025 |
10.01 (1.01%) |
9.89 |
9.89 - 10.04 |
0.7215 times |
Wed 26 November 2025 |
9.91 (1.33%) |
9.83 |
9.72 - 9.95 |
0.829 times |
Tue 25 November 2025 |
9.78 (1.03%) |
9.70 |
9.62 - 9.81 |
1.1445 times |
Mon 24 November 2025 |
9.68 (0.73%) |
9.65 |
9.58 - 9.75 |
0.9024 times |
Fri 21 November 2025 |
9.61 (1.59%) |
9.42 |
9.42 - 9.69 |
1.3142 times |
Thu 20 November 2025 |
9.46 (-0.53%) |
9.55 |
9.45 - 9.63 |
1.1893 times |
Wed 19 November 2025 |
9.51 (0.42%) |
9.46 |
9.46 - 9.62 |
1.2143 times |
Weekly price and charts GoldmanSachs Strong weekly Stock price targets for GoldmanSachs GSBD are 9.97 and 10.41 | Weekly Target 1 | 9.62 | | Weekly Target 2 | 9.87 | | Weekly Target 3 | 10.06 | | Weekly Target 4 | 10.31 | | Weekly Target 5 | 10.5 |
Weekly price and volumes for Goldman Sachs
| Date |
Closing |
Open |
Range |
Volume |
Thu 04 December 2025 |
10.12 (1.1%) |
9.93 |
9.81 - 10.25 |
0.9685 times |
Fri 28 November 2025 |
10.01 (4.16%) |
9.65 |
9.58 - 10.04 |
0.8936 times |
Fri 21 November 2025 |
9.61 (-0.83%) |
9.70 |
9.35 - 9.74 |
1.4373 times |
Fri 14 November 2025 |
9.69 (-2.02%) |
9.92 |
9.55 - 9.96 |
1.2354 times |
Fri 07 November 2025 |
9.89 (-0.9%) |
9.77 |
9.67 - 10.12 |
0.7791 times |
Fri 31 October 2025 |
9.98 (0%) |
9.88 |
9.81 - 10.04 |
0.2236 times |
Fri 31 October 2025 |
9.98 (1.73%) |
9.83 |
9.78 - 10.20 |
1.3587 times |
Fri 24 October 2025 |
9.81 (0.93%) |
9.74 |
9.69 - 9.98 |
0.8699 times |
Fri 17 October 2025 |
9.72 (1.57%) |
9.63 |
9.58 - 10.11 |
0.9128 times |
Fri 10 October 2025 |
9.57 (-6.36%) |
10.07 |
9.38 - 10.15 |
1.3212 times |
Fri 03 October 2025 |
10.22 (-6.15%) |
10.91 |
9.91 - 10.91 |
0.9807 times |

Monthly price and charts GoldmanSachs Strong monthly Stock price targets for GoldmanSachs GSBD are 9.97 and 10.41 | Monthly Target 1 | 9.62 | | Monthly Target 2 | 9.87 | | Monthly Target 3 | 10.06 | | Monthly Target 4 | 10.31 | | Monthly Target 5 | 10.5 |
Monthly price and volumes Goldman Sachs
| Date |
Closing |
Open |
Range |
Volume |
Thu 04 December 2025 |
10.12 (1.1%) |
9.93 |
9.81 - 10.25 |
0.3065 times |
Fri 28 November 2025 |
10.01 (0.3%) |
9.77 |
9.35 - 10.12 |
1.3754 times |
Fri 31 October 2025 |
9.98 (-1.87%) |
10.13 |
9.38 - 10.49 |
1.6545 times |
Tue 30 September 2025 |
10.17 (-11.1%) |
11.38 |
10.08 - 11.53 |
0.9338 times |
Fri 29 August 2025 |
11.44 (1.96%) |
11.12 |
10.94 - 11.62 |
0.7884 times |
Thu 31 July 2025 |
11.22 (-0.27%) |
11.21 |
11.16 - 12.03 |
0.9877 times |
Mon 30 June 2025 |
11.25 (-0.71%) |
11.30 |
11.12 - 11.79 |
0.7638 times |
Fri 30 May 2025 |
11.33 (6.79%) |
10.63 |
10.42 - 11.44 |
0.8203 times |
Wed 30 April 2025 |
10.61 (-8.77%) |
11.56 |
9.51 - 11.74 |
1.319 times |
Mon 31 March 2025 |
11.63 (-10.81%) |
13.05 |
11.39 - 13.07 |
1.0505 times |
Fri 28 February 2025 |
13.04 (1.56%) |
12.75 |
12.53 - 13.44 |
0.9447 times |

DMA SMA EMA moving averages of Goldman Sachs GSBD
DMA (daily moving average) of Goldman Sachs GSBD
| DMA period | DMA value | | 5 day DMA | 10.01 | | 12 day DMA | 9.79 | | 20 day DMA | 9.76 | | 35 day DMA | 9.81 | | 50 day DMA | 9.9 | | 100 day DMA | 10.64 | | 150 day DMA | 10.86 | | 200 day DMA | 11.03 | EMA (exponential moving average) of Goldman Sachs GSBD
| EMA period | EMA current | EMA prev | EMA prev2 | | 5 day EMA | 10 | 9.94 | 9.87 | | 12 day EMA | 9.89 | 9.85 | 9.81 | | 20 day EMA | 9.86 | 9.83 | 9.8 | | 35 day EMA | 9.9 | 9.89 | 9.88 | | 50 day EMA | 10.01 | 10.01 | 10.01 |
SMA (simple moving average) of Goldman Sachs GSBD
| SMA period | SMA current | SMA prev | SMA prev2 | | 5 day SMA | 10.01 | 9.97 | 9.91 | | 12 day SMA | 9.79 | 9.74 | 9.7 | | 20 day SMA | 9.76 | 9.75 | 9.73 | | 35 day SMA | 9.81 | 9.8 | 9.8 | | 50 day SMA | 9.9 | 9.91 | 9.93 | | 100 day SMA | 10.64 | 10.66 | 10.68 | | 150 day SMA | 10.86 | 10.87 | 10.87 | | 200 day SMA | 11.03 | 11.05 | 11.07 |
|
|
