GlobalPayments GPN full analysis,charts,indicators,moving averages,SMA,DMA,EMA,ADX,MACD,RSIGlobal Payments GPN WideScreen charts, DMA,SMA,EMA technical analysis, forecast prediction, by indicators ADX,MACD,RSI,CCI NYSE stock exchange
operates under Miscellaneous sector & deals in Business Services
Daily price and charts and targets GlobalPayments Strong Daily Stock price targets for GlobalPayments GPN are 78.72 and 80.22 | Daily Target 1 | 78.37 | | Daily Target 2 | 79.06 | | Daily Target 3 | 79.873333333333 | | Daily Target 4 | 80.56 | | Daily Target 5 | 81.37 |
Daily price and volume Global Payments
| Date |
Closing |
Open |
Range |
Volume |
Thu 04 December 2025 |
79.74 (-0.28%) |
80.32 |
79.19 - 80.69 |
1.2655 times |
Wed 03 December 2025 |
79.96 (1.61%) |
79.11 |
79.11 - 80.78 |
0.9355 times |
Tue 02 December 2025 |
78.69 (3.21%) |
76.78 |
75.70 - 79.24 |
1.6066 times |
Mon 01 December 2025 |
76.24 (0.63%) |
74.80 |
74.72 - 77.53 |
1.0161 times |
Fri 28 November 2025 |
75.76 (1.05%) |
75.24 |
75.01 - 76.46 |
0.4801 times |
Wed 26 November 2025 |
74.97 (1.28%) |
73.82 |
73.77 - 75.38 |
0.9292 times |
Tue 25 November 2025 |
74.02 (1.68%) |
73.19 |
73.05 - 74.74 |
0.846 times |
Mon 24 November 2025 |
72.80 (-0.94%) |
72.89 |
72.27 - 73.46 |
1.3318 times |
Fri 21 November 2025 |
73.49 (2.83%) |
72.24 |
72.13 - 74.66 |
0.8804 times |
Thu 20 November 2025 |
71.47 (-0.78%) |
73.15 |
71.38 - 73.46 |
0.7089 times |
Wed 19 November 2025 |
72.03 (0.03%) |
72.34 |
70.91 - 72.56 |
0.6967 times |
Weekly price and charts GlobalPayments Strong weekly Stock price targets for GlobalPayments GPN are 77.23 and 83.29 | Weekly Target 1 | 72.35 | | Weekly Target 2 | 76.05 | | Weekly Target 3 | 78.413333333333 | | Weekly Target 4 | 82.11 | | Weekly Target 5 | 84.47 |
Weekly price and volumes for Global Payments
| Date |
Closing |
Open |
Range |
Volume |
Thu 04 December 2025 |
79.74 (5.25%) |
74.80 |
74.72 - 80.78 |
1.3784 times |
Fri 28 November 2025 |
75.76 (3.09%) |
72.89 |
72.27 - 76.46 |
1.025 times |
Fri 21 November 2025 |
73.49 (-0.84%) |
73.92 |
70.91 - 74.66 |
0.9739 times |
Fri 14 November 2025 |
74.11 (-2.53%) |
76.75 |
73.27 - 78.48 |
1.1627 times |
Fri 07 November 2025 |
76.03 (-2.22%) |
80.70 |
74.88 - 80.99 |
1.5225 times |
Fri 31 October 2025 |
77.76 (0%) |
78.00 |
77.05 - 79.06 |
0.3447 times |
Fri 31 October 2025 |
77.76 (-10.99%) |
88.19 |
77.05 - 88.77 |
1.5045 times |
Fri 24 October 2025 |
87.36 (2.27%) |
85.84 |
85.52 - 89.01 |
0.7313 times |
Fri 17 October 2025 |
85.42 (-3.04%) |
83.67 |
83.09 - 87.29 |
1.0434 times |
Tue 07 October 2025 |
88.10 (0.16%) |
88.25 |
86.48 - 89.05 |
0.3136 times |
Fri 03 October 2025 |
87.96 (4.32%) |
85.84 |
81.98 - 88.56 |
1.4238 times |

Monthly price and charts GlobalPayments Strong monthly Stock price targets for GlobalPayments GPN are 77.23 and 83.29 | Monthly Target 1 | 72.35 | | Monthly Target 2 | 76.05 | | Monthly Target 3 | 78.413333333333 | | Monthly Target 4 | 82.11 | | Monthly Target 5 | 84.47 |
Monthly price and volumes Global Payments
| Date |
Closing |
Open |
Range |
Volume |
Thu 04 December 2025 |
79.74 (5.25%) |
74.80 |
74.72 - 80.78 |
0.2279 times |
Fri 28 November 2025 |
75.76 (-2.57%) |
80.70 |
70.91 - 80.99 |
0.7744 times |
Fri 31 October 2025 |
77.76 (-6.4%) |
83.10 |
77.05 - 89.05 |
0.7552 times |
Tue 30 September 2025 |
83.08 (-6.46%) |
87.92 |
81.98 - 89.05 |
1.0782 times |
Fri 29 August 2025 |
88.82 (11.09%) |
78.92 |
76.60 - 90.64 |
1.071 times |
Thu 31 July 2025 |
79.95 (-0.11%) |
79.78 |
77.60 - 86.21 |
0.9131 times |
Mon 30 June 2025 |
80.04 (5.86%) |
74.58 |
73.69 - 80.86 |
1.0017 times |
Fri 30 May 2025 |
75.61 (-0.92%) |
76.14 |
73.99 - 85.00 |
1.4265 times |
Wed 30 April 2025 |
76.31 (-22.07%) |
97.93 |
65.93 - 99.99 |
1.7741 times |
Mon 31 March 2025 |
97.92 (-6.99%) |
105.40 |
90.99 - 106.07 |
0.9779 times |
Fri 28 February 2025 |
105.28 (-6.71%) |
110.64 |
101.43 - 112.50 |
0.7886 times |

DMA SMA EMA moving averages of Global Payments GPN
DMA (daily moving average) of Global Payments GPN
| DMA period | DMA value | | 5 day DMA | 78.08 | | 12 day DMA | 75.1 | | 20 day DMA | 75.3 | | 35 day DMA | 78.72 | | 50 day DMA | 80.91 | | 100 day DMA | 82.77 | | 150 day DMA | 81.33 | | 200 day DMA | 84.29 | EMA (exponential moving average) of Global Payments GPN
| EMA period | EMA current | EMA prev | EMA prev2 | | 5 day EMA | 78.25 | 77.5 | 76.27 | | 12 day EMA | 76.71 | 76.16 | 75.47 | | 20 day EMA | 76.85 | 76.55 | 76.19 | | 35 day EMA | 78.52 | 78.45 | 78.36 | | 50 day EMA | 81.01 | 81.06 | 81.1 |
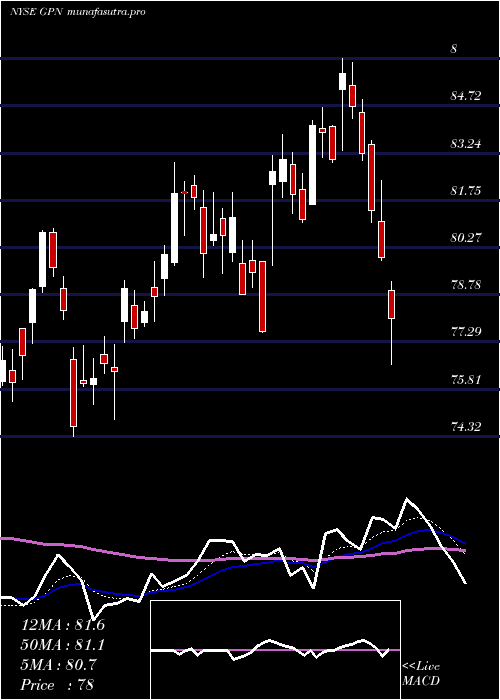
SMA (simple moving average) of Global Payments GPN
| SMA period | SMA current | SMA prev | SMA prev2 | | 5 day SMA | 78.08 | 77.12 | 75.94 | | 12 day SMA | 75.1 | 74.5 | 74.01 | | 20 day SMA | 75.3 | 75.27 | 75.27 | | 35 day SMA | 78.72 | 78.9 | 79.09 | | 50 day SMA | 80.91 | 81.05 | 81.17 | | 100 day SMA | 82.77 | 82.79 | 82.79 | | 150 day SMA | 81.33 | 81.28 | 81.23 | | 200 day SMA | 84.29 | 84.43 | 84.57 |
|
|
