GraphicPackaging GPK full analysis,charts,indicators,moving averages,SMA,DMA,EMA,ADX,MACD,RSIGraphic Packaging GPK WideScreen charts, DMA,SMA,EMA technical analysis, forecast prediction, by indicators ADX,MACD,RSI,CCI NYSE stock exchange
operates under Consumer Durables sector & deals in Containers Packaging
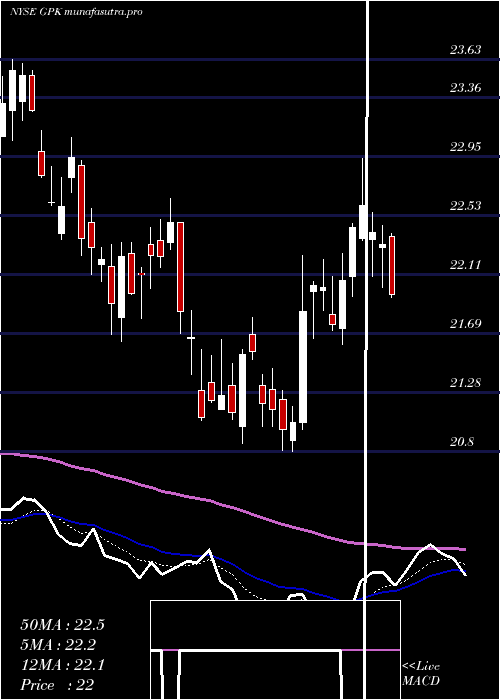
Daily price and charts and targets GraphicPackaging Strong Daily Stock price targets for GraphicPackaging GPK are 15.49 and 16.08 | Daily Target 1 | 15.39 | | Daily Target 2 | 15.59 | | Daily Target 3 | 15.976666666667 | | Daily Target 4 | 16.18 | | Daily Target 5 | 16.57 |
Daily price and volume Graphic Packaging
| Date |
Closing |
Open |
Range |
Volume |
Thu 04 December 2025 |
15.80 (-2.89%) |
16.29 |
15.77 - 16.36 |
0.9545 times |
Wed 03 December 2025 |
16.27 (-0.12%) |
16.29 |
16.14 - 16.61 |
1.3993 times |
Tue 02 December 2025 |
16.29 (-0.61%) |
16.37 |
16.12 - 16.44 |
1.1009 times |
Mon 01 December 2025 |
16.39 (1.3%) |
16.17 |
16.11 - 16.45 |
0.8083 times |
Fri 28 November 2025 |
16.18 (0.31%) |
16.25 |
16.13 - 16.31 |
0.3943 times |
Wed 26 November 2025 |
16.13 (0.12%) |
16.13 |
16.03 - 16.22 |
0.6947 times |
Tue 25 November 2025 |
16.11 (2.09%) |
15.94 |
15.90 - 16.14 |
0.871 times |
Mon 24 November 2025 |
15.78 (1.28%) |
15.41 |
15.41 - 15.82 |
1.4631 times |
Fri 21 November 2025 |
15.58 (2.7%) |
15.27 |
15.21 - 15.86 |
1.2378 times |
Thu 20 November 2025 |
15.17 (-0.85%) |
15.40 |
15.10 - 15.46 |
1.0762 times |
Wed 19 November 2025 |
15.30 (-1.1%) |
15.48 |
15.16 - 15.55 |
0.9757 times |
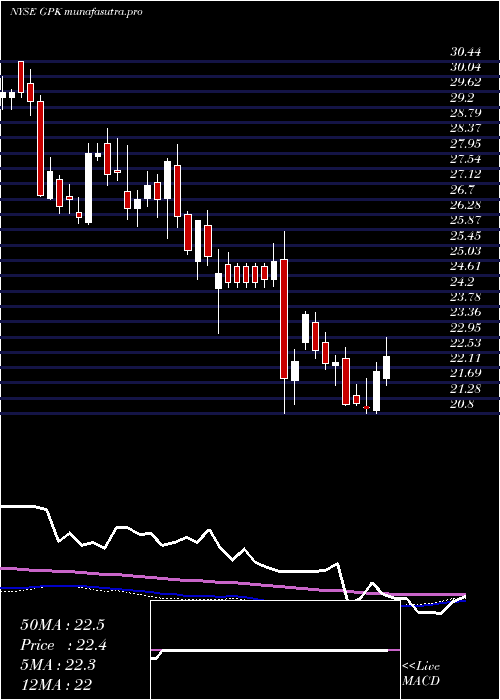
Weekly price and charts GraphicPackaging Strong weekly Stock price targets for GraphicPackaging GPK are 15.37 and 16.21 | Weekly Target 1 | 15.22 | | Weekly Target 2 | 15.51 | | Weekly Target 3 | 16.06 | | Weekly Target 4 | 16.35 | | Weekly Target 5 | 16.9 |
Weekly price and volumes for Graphic Packaging
| Date |
Closing |
Open |
Range |
Volume |
Thu 04 December 2025 |
15.80 (-2.35%) |
16.17 |
15.77 - 16.61 |
0.8245 times |
Fri 28 November 2025 |
16.18 (3.85%) |
15.41 |
15.41 - 16.31 |
0.6621 times |
Fri 21 November 2025 |
15.58 (-2.99%) |
15.94 |
15.10 - 15.94 |
1.0661 times |
Fri 14 November 2025 |
16.06 (-2.25%) |
16.34 |
15.64 - 16.60 |
1.3359 times |
Fri 07 November 2025 |
16.43 (2.75%) |
14.99 |
14.90 - 17.22 |
1.6743 times |
Fri 31 October 2025 |
15.99 (0%) |
15.91 |
15.67 - 16.06 |
0.38 times |
Fri 31 October 2025 |
15.99 (-7.47%) |
17.39 |
15.67 - 17.52 |
1.7698 times |
Fri 24 October 2025 |
17.28 (0.64%) |
17.17 |
17.17 - 18.25 |
1.044 times |
Fri 17 October 2025 |
17.17 (-9.54%) |
17.51 |
16.95 - 17.71 |
0.9732 times |
Tue 07 October 2025 |
18.98 (-2.01%) |
19.25 |
18.91 - 20.01 |
0.2701 times |
Fri 03 October 2025 |
19.37 (-0.15%) |
19.49 |
19.05 - 19.71 |
0.6661 times |
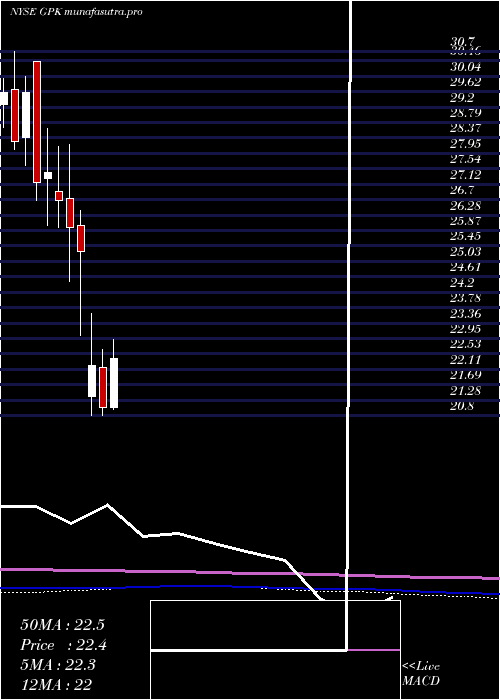
Monthly price and charts GraphicPackaging Strong monthly Stock price targets for GraphicPackaging GPK are 15.37 and 16.21 | Monthly Target 1 | 15.22 | | Monthly Target 2 | 15.51 | | Monthly Target 3 | 16.06 | | Monthly Target 4 | 16.35 | | Monthly Target 5 | 16.9 |
Monthly price and volumes Graphic Packaging
| Date |
Closing |
Open |
Range |
Volume |
Thu 04 December 2025 |
15.80 (-2.35%) |
16.17 |
15.77 - 16.61 |
0.232 times |
Fri 28 November 2025 |
16.18 (1.19%) |
14.99 |
14.90 - 17.22 |
1.3335 times |
Fri 31 October 2025 |
15.99 (-18.29%) |
19.61 |
15.67 - 20.01 |
1.3468 times |
Tue 30 September 2025 |
19.57 (-12.12%) |
22.02 |
19.05 - 22.17 |
1.2348 times |
Fri 29 August 2025 |
22.27 (-0.4%) |
22.43 |
21.45 - 23.47 |
1.0424 times |
Thu 31 July 2025 |
22.36 (6.12%) |
21.07 |
21.02 - 23.76 |
1.1435 times |
Mon 30 June 2025 |
21.07 (-5.18%) |
22.17 |
20.86 - 22.65 |
0.9223 times |
Fri 30 May 2025 |
22.22 (-12.21%) |
21.39 |
20.86 - 23.63 |
1.167 times |
Wed 30 April 2025 |
25.31 (-2.5%) |
25.99 |
23.03 - 26.40 |
0.7527 times |
Mon 31 March 2025 |
25.96 (-2.7%) |
26.72 |
24.50 - 28.19 |
0.825 times |
Fri 28 February 2025 |
26.68 (-2.73%) |
26.91 |
25.96 - 28.15 |
0.6836 times |
DMA SMA EMA moving averages of Graphic Packaging GPK
DMA (daily moving average) of Graphic Packaging GPK
| DMA period | DMA value | | 5 day DMA | 16.19 | | 12 day DMA | 15.87 | | 20 day DMA | 15.95 | | 35 day DMA | 16.4 | | 50 day DMA | 17.16 | | 100 day DMA | 19.6 | | 150 day DMA | 20.51 | | 200 day DMA | 21.83 | EMA (exponential moving average) of Graphic Packaging GPK
| EMA period | EMA current | EMA prev | EMA prev2 | | 5 day EMA | 16.07 | 16.21 | 16.18 | | 12 day EMA | 16.04 | 16.08 | 16.05 | | 20 day EMA | 16.17 | 16.21 | 16.2 | | 35 day EMA | 16.69 | 16.74 | 16.77 | | 50 day EMA | 17.31 | 17.37 | 17.41 |
SMA (simple moving average) of Graphic Packaging GPK
| SMA period | SMA current | SMA prev | SMA prev2 | | 5 day SMA | 16.19 | 16.25 | 16.22 | | 12 day SMA | 15.87 | 15.85 | 15.83 | | 20 day SMA | 15.95 | 16.01 | 16.05 | | 35 day SMA | 16.4 | 16.45 | 16.48 | | 50 day SMA | 17.16 | 17.24 | 17.31 | | 100 day SMA | 19.6 | 19.67 | 19.73 | | 150 day SMA | 20.51 | 20.57 | 20.63 | | 200 day SMA | 21.83 | 21.89 | 21.94 |
|
|
