GeorgiaPower GPJA full analysis,charts,indicators,moving averages,SMA,DMA,EMA,ADX,MACD,RSIGeorgia Power GPJA WideScreen charts, DMA,SMA,EMA technical analysis, forecast prediction, by indicators ADX,MACD,RSI,CCI NYSE stock exchange
operates under Public Utilities sector & deals in Electric Utilities Central
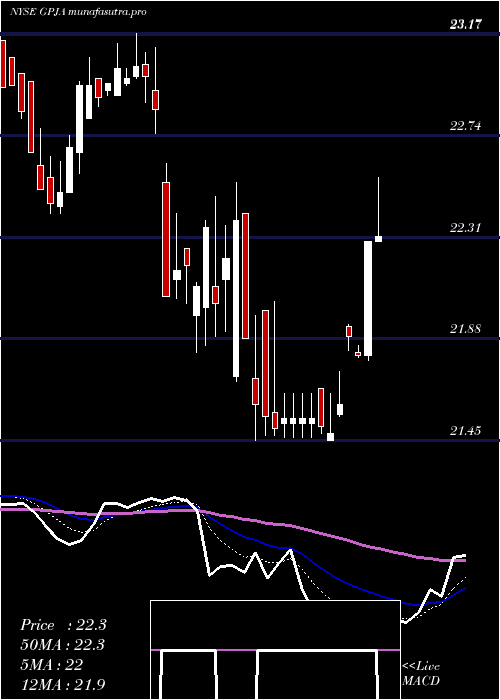
Daily price and charts and targets GeorgiaPower Strong Daily Stock price targets for GeorgiaPower GPJA are 23.32 and 23.45 | Daily Target 1 | 23.23 | | Daily Target 2 | 23.28 | | Daily Target 3 | 23.356666666667 | | Daily Target 4 | 23.41 | | Daily Target 5 | 23.49 |
Daily price and volume Georgia Power
| Date |
Closing |
Open |
Range |
Volume |
Mon 20 October 2025 |
23.34 (0.6%) |
23.33 |
23.30 - 23.43 |
0.5674 times |
Fri 17 October 2025 |
23.20 (-0.17%) |
23.12 |
23.03 - 23.25 |
1.4935 times |
Thu 16 October 2025 |
23.24 (0.3%) |
23.22 |
23.06 - 23.32 |
0.7008 times |
Wed 15 October 2025 |
23.17 (0.96%) |
23.27 |
23.07 - 23.34 |
1.4267 times |
Tue 14 October 2025 |
22.95 (-0.48%) |
22.94 |
22.92 - 23.07 |
0.4923 times |
Mon 13 October 2025 |
23.06 (-1.5%) |
23.17 |
23.00 - 23.19 |
0.3588 times |
Tue 07 October 2025 |
23.41 (-0.09%) |
23.48 |
23.30 - 23.49 |
1.4351 times |
Mon 06 October 2025 |
23.43 (0.04%) |
23.29 |
23.29 - 23.46 |
1.031 times |
Fri 03 October 2025 |
23.42 (0.17%) |
23.44 |
23.42 - 23.51 |
0.4422 times |
Thu 02 October 2025 |
23.38 (-0.81%) |
23.59 |
23.33 - 23.61 |
2.0523 times |
Wed 01 October 2025 |
23.57 (0.26%) |
23.61 |
23.38 - 23.61 |
2.6031 times |
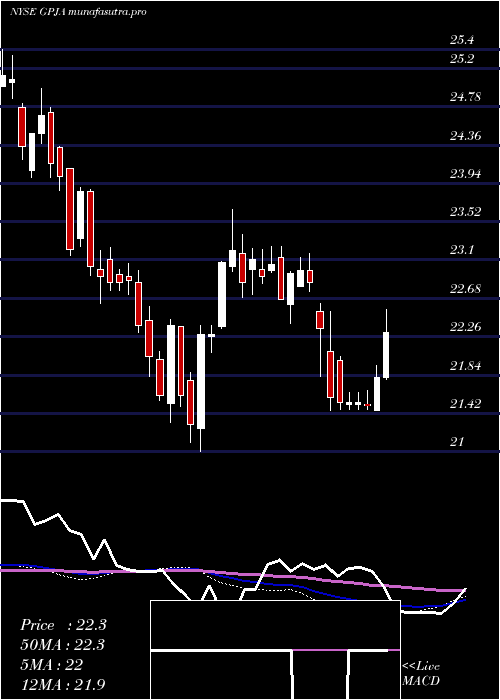
Weekly price and charts GeorgiaPower Strong weekly Stock price targets for GeorgiaPower GPJA are 23.32 and 23.45 | Weekly Target 1 | 23.23 | | Weekly Target 2 | 23.28 | | Weekly Target 3 | 23.356666666667 | | Weekly Target 4 | 23.41 | | Weekly Target 5 | 23.49 |
Weekly price and volumes for Georgia Power
| Date |
Closing |
Open |
Range |
Volume |
Mon 20 October 2025 |
23.34 (0.6%) |
23.33 |
23.30 - 23.43 |
0.056 times |
Fri 17 October 2025 |
23.20 (-0.9%) |
23.17 |
22.92 - 23.34 |
0.4412 times |
Tue 07 October 2025 |
23.41 (-0.04%) |
23.29 |
23.29 - 23.49 |
0.2433 times |
Fri 03 October 2025 |
23.42 (-1.47%) |
23.88 |
23.33 - 23.88 |
3.067 times |
Fri 26 September 2025 |
23.77 (-0.21%) |
23.79 |
23.50 - 24.00 |
1.1022 times |
Fri 19 September 2025 |
23.82 (1.06%) |
23.61 |
23.56 - 23.83 |
0.7285 times |
Fri 12 September 2025 |
23.57 (2.3%) |
23.13 |
22.96 - 23.60 |
0.7779 times |
Fri 05 September 2025 |
23.04 (2.4%) |
22.54 |
22.49 - 23.05 |
1.5533 times |
Fri 29 August 2025 |
22.50 (0%) |
22.96 |
22.38 - 23.05 |
0.8199 times |
Fri 29 August 2025 |
22.50 (-2.56%) |
23.04 |
22.38 - 23.18 |
1.2108 times |
Fri 22 August 2025 |
23.09 (1.49%) |
22.75 |
22.65 - 23.20 |
1.3088 times |
Monthly price and charts GeorgiaPower Strong monthly Stock price targets for GeorgiaPower GPJA are 22.79 and 23.48 | Monthly Target 1 | 22.6 | | Monthly Target 2 | 22.97 | | Monthly Target 3 | 23.29 | | Monthly Target 4 | 23.66 | | Monthly Target 5 | 23.98 |
Monthly price and volumes Georgia Power
| Date |
Closing |
Open |
Range |
Volume |
Mon 20 October 2025 |
23.34 (-0.72%) |
23.61 |
22.92 - 23.61 |
0.3056 times |
Tue 30 September 2025 |
23.51 (4.49%) |
22.54 |
22.49 - 24.00 |
1.653 times |
Fri 29 August 2025 |
22.50 (2.97%) |
21.68 |
21.53 - 23.20 |
1.2579 times |
Thu 31 July 2025 |
21.85 (6.38%) |
20.60 |
20.55 - 21.93 |
1.1461 times |
Mon 30 June 2025 |
20.54 (-6.97%) |
21.99 |
20.29 - 21.99 |
1.3844 times |
Fri 30 May 2025 |
22.08 (0.23%) |
22.03 |
21.76 - 22.68 |
0.5339 times |
Wed 30 April 2025 |
22.03 (-0.14%) |
22.13 |
21.45 - 22.56 |
0.6637 times |
Mon 31 March 2025 |
22.06 (-4.3%) |
23.13 |
22.06 - 23.25 |
0.6838 times |
Fri 28 February 2025 |
23.05 (-0.69%) |
23.17 |
22.69 - 23.38 |
0.5428 times |
Fri 31 January 2025 |
23.21 (7.45%) |
21.74 |
21.00 - 23.65 |
1.8288 times |
Tue 31 December 2024 |
21.60 (-5.47%) |
22.92 |
21.32 - 23.06 |
1.2959 times |

DMA SMA EMA moving averages of Georgia Power GPJA
DMA (daily moving average) of Georgia Power GPJA
| DMA period | DMA value | | 5 day DMA | 23.18 | | 12 day DMA | 23.31 | | 20 day DMA | 23.5 | | 35 day DMA | 23.34 | | 50 day DMA | 23.18 | | 100 day DMA | 22.3 | | 150 day DMA | 22.27 | | 200 day DMA | 22.36 | EMA (exponential moving average) of Georgia Power GPJA
| EMA period | EMA current | EMA prev | EMA prev2 | | 5 day EMA | 23.25 | 23.21 | 23.21 | | 12 day EMA | 23.31 | 23.3 | 23.32 | | 20 day EMA | 23.34 | 23.34 | 23.35 | | 35 day EMA | 23.25 | 23.24 | 23.24 | | 50 day EMA | 23.09 | 23.08 | 23.08 |
SMA (simple moving average) of Georgia Power GPJA
| SMA period | SMA current | SMA prev | SMA prev2 | | 5 day SMA | 23.18 | 23.12 | 23.17 | | 12 day SMA | 23.31 | 23.35 | 23.39 | | 20 day SMA | 23.5 | 23.52 | 23.54 | | 35 day SMA | 23.34 | 23.33 | 23.33 | | 50 day SMA | 23.18 | 23.16 | 23.14 | | 100 day SMA | 22.3 | 22.29 | 22.28 | | 150 day SMA | 22.27 | 22.26 | 22.26 | | 200 day SMA | 22.36 | 22.36 | 22.35 |
|
|
