GuggenheimStrategic GOF full analysis,charts,indicators,moving averages,SMA,DMA,EMA,ADX,MACD,RSIGuggenheim Strategic GOF WideScreen charts, DMA,SMA,EMA technical analysis, forecast prediction, by indicators ADX,MACD,RSI,CCI NYSE stock exchange
operates under N A sector & deals in N A
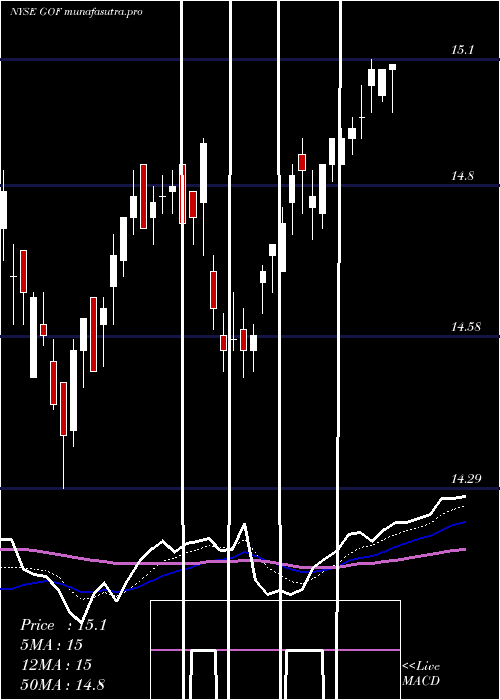
Daily price and charts and targets GuggenheimStrategic Strong Daily Stock price targets for GuggenheimStrategic GOF are 12 and 12.16 | Daily Target 1 | 11.94 | | Daily Target 2 | 12.01 | | Daily Target 3 | 12.1 | | Daily Target 4 | 12.17 | | Daily Target 5 | 12.26 |
Daily price and volume Guggenheim Strategic
| Date |
Closing |
Open |
Range |
Volume |
Fri 05 December 2025 |
12.08 (0.17%) |
12.08 |
12.03 - 12.19 |
0.6734 times |
Thu 04 December 2025 |
12.06 (-0.5%) |
12.14 |
12.03 - 12.19 |
1.5908 times |
Wed 03 December 2025 |
12.12 (-0.66%) |
12.17 |
12.11 - 12.20 |
0.8434 times |
Tue 02 December 2025 |
12.20 (-0.33%) |
12.27 |
12.18 - 12.32 |
0.7675 times |
Mon 01 December 2025 |
12.24 (-1.53%) |
12.35 |
12.23 - 12.39 |
0.822 times |
Fri 28 November 2025 |
12.43 (0.16%) |
12.43 |
12.29 - 12.47 |
0.9224 times |
Wed 26 November 2025 |
12.41 (-0.16%) |
12.43 |
12.36 - 12.50 |
0.7942 times |
Tue 25 November 2025 |
12.43 (1.55%) |
12.19 |
12.19 - 12.43 |
1.0305 times |
Mon 24 November 2025 |
12.24 (2%) |
12.09 |
12.04 - 12.30 |
1.1378 times |
Fri 21 November 2025 |
12.00 (0.17%) |
12.00 |
11.87 - 12.12 |
1.418 times |
Thu 20 November 2025 |
11.98 (0%) |
12.21 |
11.95 - 12.21 |
1.2989 times |
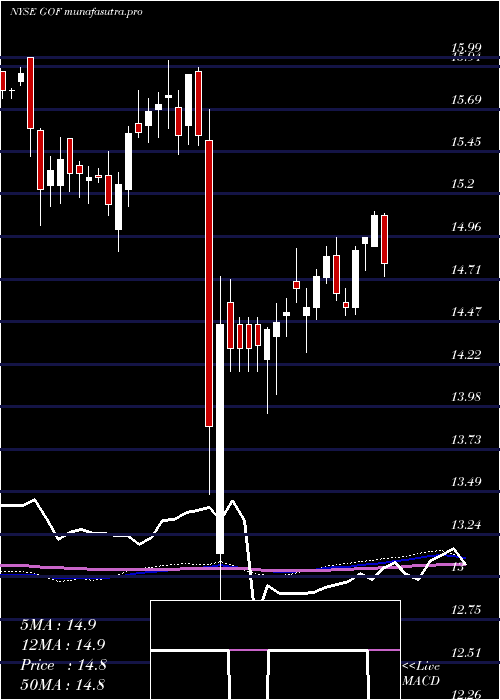
Weekly price and charts GuggenheimStrategic Strong weekly Stock price targets for GuggenheimStrategic GOF are 11.88 and 12.24 | Weekly Target 1 | 11.81 | | Weekly Target 2 | 11.94 | | Weekly Target 3 | 12.166666666667 | | Weekly Target 4 | 12.3 | | Weekly Target 5 | 12.53 |
Weekly price and volumes for Guggenheim Strategic
| Date |
Closing |
Open |
Range |
Volume |
Fri 05 December 2025 |
12.08 (-2.82%) |
12.35 |
12.03 - 12.39 |
0.8464 times |
Fri 28 November 2025 |
12.43 (3.58%) |
12.09 |
12.04 - 12.50 |
0.7001 times |
Fri 21 November 2025 |
12.00 (-7.05%) |
12.92 |
11.87 - 12.92 |
1.4893 times |
Fri 14 November 2025 |
12.91 (-1.53%) |
13.21 |
12.85 - 13.35 |
0.6951 times |
Fri 07 November 2025 |
13.11 (-3.25%) |
12.95 |
12.90 - 13.28 |
0.7348 times |
Fri 31 October 2025 |
13.55 (0%) |
13.50 |
13.35 - 13.64 |
0.1595 times |
Fri 31 October 2025 |
13.55 (-1.95%) |
13.94 |
12.85 - 13.98 |
1.5498 times |
Fri 24 October 2025 |
13.82 (-1.92%) |
14.20 |
12.65 - 14.21 |
2.2538 times |
Fri 17 October 2025 |
14.09 (-6.38%) |
14.97 |
13.95 - 15.01 |
1.345 times |
Tue 07 October 2025 |
15.05 (0.33%) |
15.02 |
14.98 - 15.07 |
0.2262 times |
Fri 03 October 2025 |
15.00 (0.6%) |
14.93 |
14.86 - 15.12 |
0.5224 times |
Monthly price and charts GuggenheimStrategic Strong monthly Stock price targets for GuggenheimStrategic GOF are 11.88 and 12.24 | Monthly Target 1 | 11.81 | | Monthly Target 2 | 11.94 | | Monthly Target 3 | 12.166666666667 | | Monthly Target 4 | 12.3 | | Monthly Target 5 | 12.53 |
Monthly price and volumes Guggenheim Strategic
| Date |
Closing |
Open |
Range |
Volume |
Fri 05 December 2025 |
12.08 (-2.82%) |
12.35 |
12.03 - 12.39 |
0.3331 times |
Fri 28 November 2025 |
12.43 (-8.27%) |
12.95 |
11.87 - 13.35 |
1.4245 times |
Fri 31 October 2025 |
13.55 (-9.55%) |
15.00 |
12.65 - 15.12 |
2.3023 times |
Tue 30 September 2025 |
14.98 (0.33%) |
14.90 |
14.82 - 15.16 |
0.8493 times |
Fri 29 August 2025 |
14.93 (0.34%) |
14.85 |
14.72 - 15.10 |
0.8013 times |
Thu 31 July 2025 |
14.88 (-0.07%) |
14.82 |
14.73 - 15.20 |
0.8157 times |
Mon 30 June 2025 |
14.89 (1.09%) |
14.72 |
14.50 - 14.95 |
0.5866 times |
Fri 30 May 2025 |
14.73 (1.87%) |
14.51 |
14.05 - 14.89 |
0.7673 times |
Wed 30 April 2025 |
14.46 (-7.13%) |
15.52 |
12.26 - 15.69 |
1.2171 times |
Mon 31 March 2025 |
15.57 (-0.95%) |
15.76 |
15.38 - 15.97 |
0.9026 times |
Fri 28 February 2025 |
15.72 (3.01%) |
15.23 |
15.13 - 15.80 |
0.7714 times |

DMA SMA EMA moving averages of Guggenheim Strategic GOF
DMA (daily moving average) of Guggenheim Strategic GOF
| DMA period | DMA value | | 5 day DMA | 12.14 | | 12 day DMA | 12.18 | | 20 day DMA | 12.47 | | 35 day DMA | 12.85 | | 50 day DMA | 13.47 | | 100 day DMA | 14.21 | | 150 day DMA | 14.38 | | 200 day DMA | 14.57 | EMA (exponential moving average) of Guggenheim Strategic GOF
| EMA period | EMA current | EMA prev | EMA prev2 | | 5 day EMA | 12.14 | 12.17 | 12.23 | | 12 day EMA | 12.27 | 12.31 | 12.36 | | 20 day EMA | 12.49 | 12.53 | 12.58 | | 35 day EMA | 12.96 | 13.01 | 13.07 | | 50 day EMA | 13.45 | 13.51 | 13.57 |
SMA (simple moving average) of Guggenheim Strategic GOF
| SMA period | SMA current | SMA prev | SMA prev2 | | 5 day SMA | 12.14 | 12.21 | 12.28 | | 12 day SMA | 12.18 | 12.17 | 12.2 | | 20 day SMA | 12.47 | 12.52 | 12.58 | | 35 day SMA | 12.85 | 12.92 | 13 | | 50 day SMA | 13.47 | 13.53 | 13.59 | | 100 day SMA | 14.21 | 14.24 | 14.27 | | 150 day SMA | 14.38 | 14.39 | 14.41 | | 200 day SMA | 14.57 | 14.59 | 14.61 |
|
|
