GamcoNatural GNT full analysis,charts,indicators,moving averages,SMA,DMA,EMA,ADX,MACD,RSIGamco Natural GNT WideScreen charts, DMA,SMA,EMA technical analysis, forecast prediction, by indicators ADX,MACD,RSI,CCI NYSE stock exchange
operates under N A sector & deals in N A
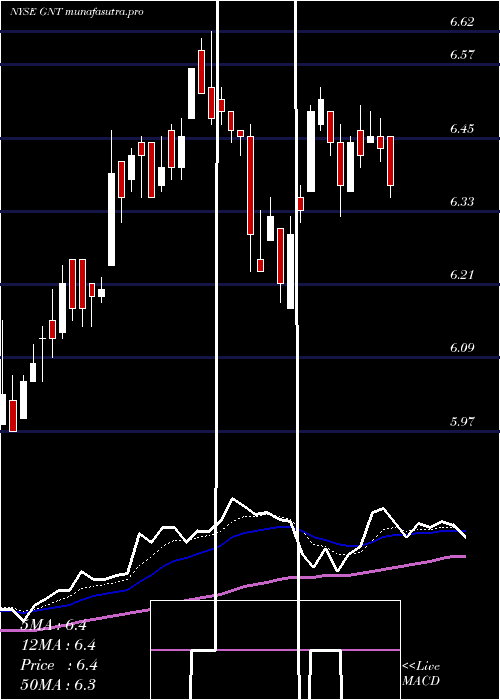
Daily price and charts and targets GamcoNatural Strong Daily Stock price targets for GamcoNatural GNT are 6.65 and 6.87 | Daily Target 1 | 6.6 | | Daily Target 2 | 6.7 | | Daily Target 3 | 6.8166666666667 | | Daily Target 4 | 6.92 | | Daily Target 5 | 7.04 |
Daily price and volume Gamco Natural
| Date |
Closing |
Open |
Range |
Volume |
Tue 21 October 2025 |
6.81 (-3.27%) |
6.93 |
6.71 - 6.93 |
1.4459 times |
Mon 20 October 2025 |
7.04 (2.03%) |
6.93 |
6.93 - 7.15 |
0.6411 times |
Fri 17 October 2025 |
6.90 (-4.03%) |
7.14 |
6.86 - 7.14 |
1.9171 times |
Thu 16 October 2025 |
7.19 (-0.28%) |
7.22 |
7.18 - 7.24 |
1.2986 times |
Wed 15 October 2025 |
7.21 (1.84%) |
7.15 |
7.10 - 7.21 |
1.192 times |
Tue 14 October 2025 |
7.08 (-0.98%) |
7.11 |
7.07 - 7.16 |
0.6835 times |
Mon 13 October 2025 |
7.15 (0.56%) |
7.12 |
7.08 - 7.18 |
0.8507 times |
Tue 07 October 2025 |
7.11 (-0.56%) |
7.18 |
7.10 - 7.18 |
0.9755 times |
Mon 06 October 2025 |
7.15 (0.42%) |
7.11 |
7.09 - 7.18 |
0.5973 times |
Fri 03 October 2025 |
7.12 (1.14%) |
7.09 |
7.04 - 7.12 |
0.3984 times |
Thu 02 October 2025 |
7.04 (-0.71%) |
7.11 |
6.99 - 7.11 |
0.9799 times |
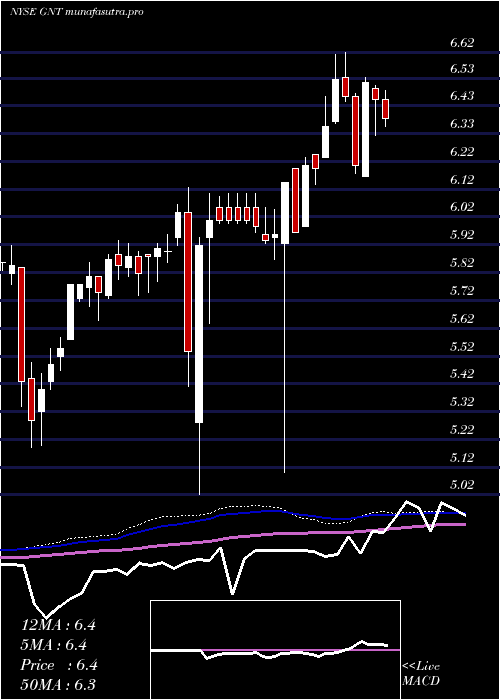
Weekly price and charts GamcoNatural Strong weekly Stock price targets for GamcoNatural GNT are 6.54 and 6.98 | Weekly Target 1 | 6.45 | | Weekly Target 2 | 6.63 | | Weekly Target 3 | 6.89 | | Weekly Target 4 | 7.07 | | Weekly Target 5 | 7.33 |
Weekly price and volumes for Gamco Natural
| Date |
Closing |
Open |
Range |
Volume |
Tue 21 October 2025 |
6.81 (-1.3%) |
6.93 |
6.71 - 7.15 |
0.6493 times |
Fri 17 October 2025 |
6.90 (-2.95%) |
7.12 |
6.86 - 7.24 |
1.8488 times |
Tue 07 October 2025 |
7.11 (-0.14%) |
7.11 |
7.09 - 7.18 |
0.4893 times |
Fri 03 October 2025 |
7.12 (1.71%) |
7.06 |
6.99 - 7.12 |
0.9717 times |
Fri 26 September 2025 |
7.00 (1.01%) |
6.98 |
6.91 - 7.07 |
1.7111 times |
Fri 19 September 2025 |
6.93 (-1.14%) |
7.03 |
6.83 - 7.09 |
1.1927 times |
Fri 12 September 2025 |
7.01 (1.74%) |
6.91 |
6.90 - 7.01 |
1.0305 times |
Fri 05 September 2025 |
6.89 (0.88%) |
6.85 |
6.82 - 6.94 |
1.1523 times |
Fri 29 August 2025 |
6.83 (0%) |
6.69 |
6.69 - 6.84 |
0.1981 times |
Fri 29 August 2025 |
6.83 (2.71%) |
6.62 |
6.61 - 6.84 |
0.7561 times |
Fri 22 August 2025 |
6.65 (2.15%) |
6.50 |
6.43 - 6.65 |
0.6019 times |
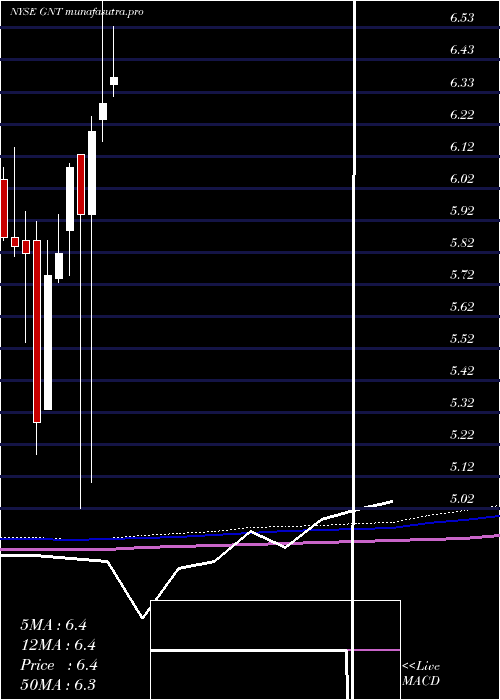
Monthly price and charts GamcoNatural Strong monthly Stock price targets for GamcoNatural GNT are 6.5 and 7.03 | Monthly Target 1 | 6.39 | | Monthly Target 2 | 6.6 | | Monthly Target 3 | 6.92 | | Monthly Target 4 | 7.13 | | Monthly Target 5 | 7.45 |
Monthly price and volumes Gamco Natural
| Date |
Closing |
Open |
Range |
Volume |
Tue 21 October 2025 |
6.81 (-3.13%) |
7.03 |
6.71 - 7.24 |
1.1812 times |
Tue 30 September 2025 |
7.03 (2.93%) |
6.85 |
6.82 - 7.09 |
1.7643 times |
Fri 29 August 2025 |
6.83 (8.59%) |
6.31 |
6.22 - 6.84 |
0.7568 times |
Thu 31 July 2025 |
6.29 (0%) |
6.35 |
6.22 - 6.53 |
0.916 times |
Mon 30 June 2025 |
6.29 (1.45%) |
6.24 |
6.17 - 6.62 |
0.8548 times |
Fri 30 May 2025 |
6.20 (4.38%) |
5.94 |
5.10 - 6.25 |
0.9517 times |
Wed 30 April 2025 |
5.94 (-2.46%) |
6.13 |
5.02 - 6.13 |
1.3567 times |
Mon 31 March 2025 |
6.09 (4.64%) |
5.89 |
5.75 - 6.10 |
0.7383 times |
Fri 28 February 2025 |
5.82 (1.22%) |
5.74 |
5.73 - 5.94 |
0.7183 times |
Fri 31 January 2025 |
5.75 (8.7%) |
5.33 |
5.33 - 5.86 |
0.7619 times |
Tue 31 December 2024 |
5.29 (-9.11%) |
5.86 |
5.19 - 5.92 |
0.5345 times |
DMA SMA EMA moving averages of Gamco Natural GNT
DMA (daily moving average) of Gamco Natural GNT
| DMA period | DMA value | | 5 day DMA | 7.03 | | 12 day DMA | 7.07 | | 20 day DMA | 7.05 | | 35 day DMA | 6.99 | | 50 day DMA | 6.86 | | 100 day DMA | 6.62 | | 150 day DMA | 6.4 | | 200 day DMA | 6.24 | EMA (exponential moving average) of Gamco Natural GNT
| EMA period | EMA current | EMA prev | EMA prev2 | | 5 day EMA | 6.98 | 7.06 | 7.07 | | 12 day EMA | 7.03 | 7.07 | 7.08 | | 20 day EMA | 7.02 | 7.04 | 7.04 | | 35 day EMA | 6.94 | 6.95 | 6.94 | | 50 day EMA | 6.84 | 6.84 | 6.83 |
SMA (simple moving average) of Gamco Natural GNT
| SMA period | SMA current | SMA prev | SMA prev2 | | 5 day SMA | 7.03 | 7.08 | 7.11 | | 12 day SMA | 7.07 | 7.09 | 7.09 | | 20 day SMA | 7.05 | 7.05 | 7.04 | | 35 day SMA | 6.99 | 6.99 | 6.98 | | 50 day SMA | 6.86 | 6.86 | 6.85 | | 100 day SMA | 6.62 | 6.62 | 6.61 | | 150 day SMA | 6.4 | 6.39 | 6.38 | | 200 day SMA | 6.24 | 6.23 | 6.22 |
|
|
