GlobalNet GNL full analysis,charts,indicators,moving averages,SMA,DMA,EMA,ADX,MACD,RSIGlobal Net GNL WideScreen charts, DMA,SMA,EMA technical analysis, forecast prediction, by indicators ADX,MACD,RSI,CCI NYSE stock exchange
operates under Consumer Services sector & deals in Real Estate Investment Trusts
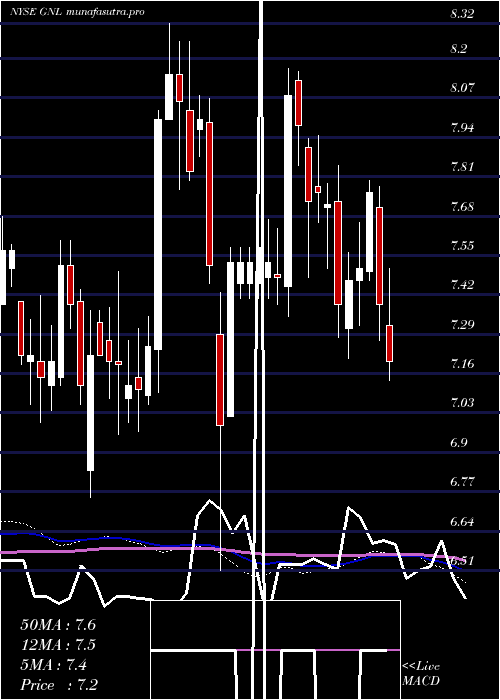
Daily price and charts and targets GlobalNet Strong Daily Stock price targets for GlobalNet GNL are 7.51 and 7.69 | Daily Target 1 | 7.47 | | Daily Target 2 | 7.55 | | Daily Target 3 | 7.6533333333333 | | Daily Target 4 | 7.73 | | Daily Target 5 | 7.83 |
Daily price and volume Global Net
| Date |
Closing |
Open |
Range |
Volume |
Tue 21 October 2025 |
7.62 (-1.68%) |
7.75 |
7.58 - 7.76 |
0.686 times |
Mon 20 October 2025 |
7.75 (0.91%) |
7.71 |
7.64 - 7.76 |
0.767 times |
Fri 17 October 2025 |
7.68 (-1.16%) |
7.81 |
7.65 - 7.85 |
0.8063 times |
Thu 16 October 2025 |
7.77 (-2.26%) |
7.87 |
7.76 - 7.99 |
0.9008 times |
Wed 15 October 2025 |
7.95 (2.71%) |
7.80 |
7.79 - 7.97 |
1.2585 times |
Tue 14 October 2025 |
7.74 (2.11%) |
7.54 |
7.54 - 7.77 |
0.9777 times |
Mon 13 October 2025 |
7.58 (-5.37%) |
7.62 |
7.51 - 7.66 |
0.8151 times |
Tue 07 October 2025 |
8.01 (-0.62%) |
8.07 |
8.00 - 8.10 |
1.5885 times |
Mon 06 October 2025 |
8.06 (-1.71%) |
8.19 |
8.04 - 8.19 |
1.1726 times |
Fri 03 October 2025 |
8.20 (0.86%) |
8.18 |
8.16 - 8.32 |
1.0275 times |
Thu 02 October 2025 |
8.13 (-0.73%) |
8.27 |
8.07 - 8.27 |
0.6295 times |

Weekly price and charts GlobalNet Strong weekly Stock price targets for GlobalNet GNL are 7.51 and 7.69 | Weekly Target 1 | 7.47 | | Weekly Target 2 | 7.55 | | Weekly Target 3 | 7.6533333333333 | | Weekly Target 4 | 7.73 | | Weekly Target 5 | 7.83 |
Weekly price and volumes for Global Net
| Date |
Closing |
Open |
Range |
Volume |
Tue 21 October 2025 |
7.62 (-0.78%) |
7.71 |
7.58 - 7.76 |
0.4047 times |
Fri 17 October 2025 |
7.68 (-4.12%) |
7.62 |
7.51 - 7.99 |
1.3254 times |
Tue 07 October 2025 |
8.01 (-2.32%) |
8.19 |
8.00 - 8.19 |
0.7691 times |
Fri 03 October 2025 |
8.20 (0.61%) |
8.17 |
8.03 - 8.32 |
1.1324 times |
Fri 26 September 2025 |
8.15 (1.24%) |
8.03 |
8.01 - 8.18 |
1.1037 times |
Fri 19 September 2025 |
8.05 (-1.83%) |
8.23 |
8.02 - 8.27 |
1.6458 times |
Fri 12 September 2025 |
8.20 (2.12%) |
7.99 |
7.96 - 8.35 |
1.3766 times |
Fri 05 September 2025 |
8.03 (2.03%) |
7.84 |
7.74 - 8.14 |
0.9923 times |
Fri 29 August 2025 |
7.87 (0%) |
7.77 |
7.76 - 7.90 |
0.2347 times |
Fri 29 August 2025 |
7.87 (0.13%) |
7.86 |
7.65 - 7.90 |
1.0154 times |
Fri 22 August 2025 |
7.86 (5.08%) |
7.49 |
7.45 - 7.99 |
1.1155 times |
Monthly price and charts GlobalNet Strong monthly Stock price targets for GlobalNet GNL are 7.16 and 7.97 | Monthly Target 1 | 7.01 | | Monthly Target 2 | 7.31 | | Monthly Target 3 | 7.8166666666667 | | Monthly Target 4 | 8.12 | | Monthly Target 5 | 8.63 |
Monthly price and volumes Global Net
| Date |
Closing |
Open |
Range |
Volume |
Tue 21 October 2025 |
7.62 (-6.27%) |
8.14 |
7.51 - 8.32 |
0.4793 times |
Tue 30 September 2025 |
8.13 (3.3%) |
7.84 |
7.74 - 8.35 |
0.8567 times |
Fri 29 August 2025 |
7.87 (12.59%) |
7.04 |
6.77 - 7.99 |
0.9455 times |
Thu 31 July 2025 |
6.99 (-7.42%) |
7.52 |
6.96 - 7.80 |
1.2767 times |
Mon 30 June 2025 |
7.55 (-2.71%) |
7.71 |
7.21 - 7.85 |
1.2048 times |
Fri 30 May 2025 |
7.76 (2.78%) |
7.55 |
7.35 - 8.17 |
0.9601 times |
Wed 30 April 2025 |
7.55 (-6.09%) |
8.00 |
6.51 - 8.07 |
1.417 times |
Mon 31 March 2025 |
8.04 (0.5%) |
8.00 |
7.77 - 8.32 |
1.061 times |
Fri 28 February 2025 |
8.00 (11.27%) |
7.08 |
6.97 - 8.03 |
0.8427 times |
Fri 31 January 2025 |
7.19 (-1.51%) |
7.38 |
6.75 - 7.60 |
0.9562 times |
Tue 31 December 2024 |
7.30 (-3.57%) |
7.40 |
7.00 - 7.42 |
0.813 times |

DMA SMA EMA moving averages of Global Net GNL
DMA (daily moving average) of Global Net GNL
| DMA period | DMA value | | 5 day DMA | 7.75 | | 12 day DMA | 7.89 | | 20 day DMA | 7.96 | | 35 day DMA | 8.01 | | 50 day DMA | 7.91 | | 100 day DMA | 7.66 | | 150 day DMA | 7.66 | | 200 day DMA | 7.59 | EMA (exponential moving average) of Global Net GNL
| EMA period | EMA current | EMA prev | EMA prev2 | | 5 day EMA | 7.73 | 7.78 | 7.79 | | 12 day EMA | 7.84 | 7.88 | 7.9 | | 20 day EMA | 7.88 | 7.91 | 7.93 | | 35 day EMA | 7.87 | 7.88 | 7.89 | | 50 day EMA | 7.81 | 7.82 | 7.82 |
SMA (simple moving average) of Global Net GNL
| SMA period | SMA current | SMA prev | SMA prev2 | | 5 day SMA | 7.75 | 7.78 | 7.74 | | 12 day SMA | 7.89 | 7.93 | 7.96 | | 20 day SMA | 7.96 | 7.99 | 8.01 | | 35 day SMA | 8.01 | 8.01 | 8.01 | | 50 day SMA | 7.91 | 7.9 | 7.88 | | 100 day SMA | 7.66 | 7.66 | 7.66 | | 150 day SMA | 7.66 | 7.67 | 7.67 | | 200 day SMA | 7.59 | 7.59 | 7.59 |
|
|
