GamestopCorporation GME full analysis,charts,indicators,moving averages,SMA,DMA,EMA,ADX,MACD,RSIGamestop Corporation GME WideScreen charts, DMA,SMA,EMA technical analysis, forecast prediction, by indicators ADX,MACD,RSI,CCI NYSE stock exchange
operates under Consumer Services sector & deals in Electronics Distribution
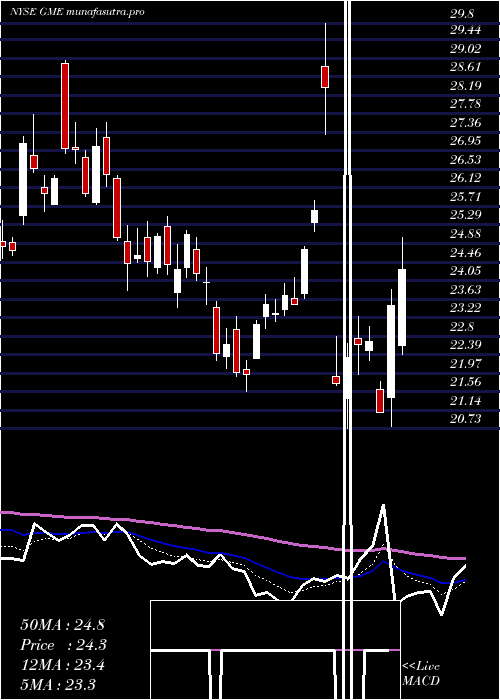
Daily price and charts and targets GamestopCorporation Strong Daily Stock price targets for GamestopCorporation GME are 22.41 and 23.23 | Daily Target 1 | 22.21 | | Daily Target 2 | 22.6 | | Daily Target 3 | 23.033333333333 | | Daily Target 4 | 23.42 | | Daily Target 5 | 23.85 |
Daily price and volume Gamestop Corporation
| Date |
Closing |
Open |
Range |
Volume |
Thu 04 December 2025 |
22.98 (-0.99%) |
23.30 |
22.65 - 23.47 |
0.6746 times |
Wed 03 December 2025 |
23.21 (1.75%) |
22.91 |
22.72 - 23.28 |
1.8531 times |
Tue 02 December 2025 |
22.81 (0.09%) |
22.83 |
22.48 - 23.37 |
0.8301 times |
Mon 01 December 2025 |
22.79 (1.15%) |
22.15 |
22.11 - 23.07 |
1.3199 times |
Fri 28 November 2025 |
22.53 (4.11%) |
22.28 |
22.04 - 22.75 |
1.47 times |
Wed 26 November 2025 |
21.64 (2.75%) |
21.17 |
21.11 - 21.83 |
0.6254 times |
Tue 25 November 2025 |
21.06 (2.73%) |
20.50 |
20.28 - 21.36 |
0.6453 times |
Mon 24 November 2025 |
20.50 (1.79%) |
20.19 |
20.12 - 20.56 |
0.6538 times |
Fri 21 November 2025 |
20.14 (1%) |
19.95 |
19.94 - 20.63 |
0.9194 times |
Thu 20 November 2025 |
19.94 (-2.35%) |
20.55 |
19.93 - 20.69 |
1.0083 times |
Wed 19 November 2025 |
20.42 (-0.29%) |
20.40 |
20.11 - 20.51 |
0.8688 times |
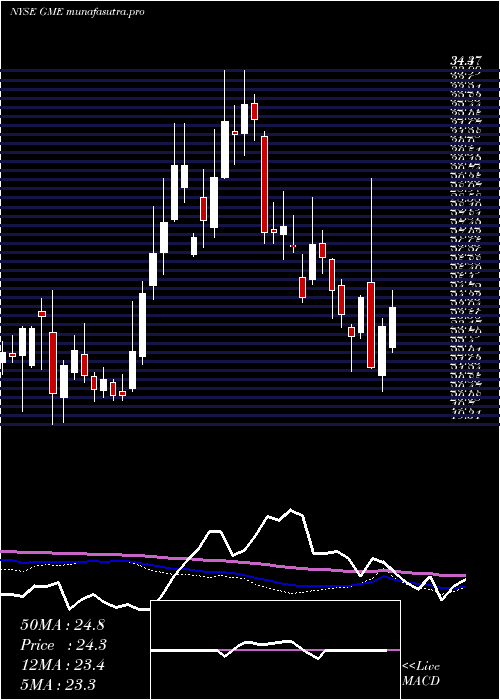
Weekly price and charts GamestopCorporation Strong weekly Stock price targets for GamestopCorporation GME are 22.55 and 23.91 | Weekly Target 1 | 21.49 | | Weekly Target 2 | 22.24 | | Weekly Target 3 | 22.853333333333 | | Weekly Target 4 | 23.6 | | Weekly Target 5 | 24.21 |
Weekly price and volumes for Gamestop Corporation
| Date |
Closing |
Open |
Range |
Volume |
Thu 04 December 2025 |
22.98 (2%) |
22.15 |
22.11 - 23.47 |
1.2266 times |
Fri 28 November 2025 |
22.53 (11.87%) |
20.19 |
20.12 - 22.75 |
0.8901 times |
Fri 21 November 2025 |
20.14 (-2.52%) |
20.57 |
19.93 - 20.84 |
1.0781 times |
Fri 14 November 2025 |
20.66 (-3.86%) |
21.67 |
20.41 - 21.81 |
0.9122 times |
Fri 07 November 2025 |
21.49 (-3.59%) |
22.00 |
20.95 - 22.34 |
0.7635 times |
Fri 31 October 2025 |
22.29 (0%) |
22.77 |
22.29 - 22.80 |
0.2189 times |
Fri 31 October 2025 |
22.29 (-4.29%) |
24.50 |
22.29 - 24.54 |
1.514 times |
Fri 24 October 2025 |
23.29 (0.95%) |
23.24 |
22.24 - 23.93 |
1.2435 times |
Fri 17 October 2025 |
23.07 (-5.26%) |
23.48 |
22.86 - 23.80 |
1.2282 times |
Tue 07 October 2025 |
24.35 (-4.32%) |
25.89 |
24.31 - 25.92 |
0.925 times |
Fri 03 October 2025 |
25.45 (-3.67%) |
27.20 |
25.09 - 28.30 |
1.8892 times |
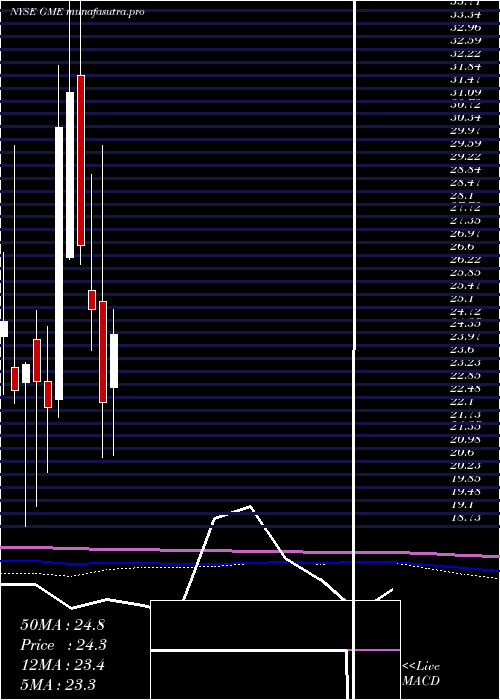
Monthly price and charts GamestopCorporation Strong monthly Stock price targets for GamestopCorporation GME are 22.55 and 23.91 | Monthly Target 1 | 21.49 | | Monthly Target 2 | 22.24 | | Monthly Target 3 | 22.853333333333 | | Monthly Target 4 | 23.6 | | Monthly Target 5 | 24.21 |
Monthly price and volumes Gamestop Corporation
| Date |
Closing |
Open |
Range |
Volume |
Thu 04 December 2025 |
22.98 (2%) |
22.15 |
22.11 - 23.47 |
0.1503 times |
Fri 28 November 2025 |
22.53 (1.08%) |
22.00 |
19.93 - 22.75 |
0.4464 times |
Fri 31 October 2025 |
22.29 (-18.29%) |
27.25 |
22.24 - 28.30 |
0.788 times |
Tue 30 September 2025 |
27.28 (21.73%) |
22.36 |
22.18 - 27.34 |
1.2383 times |
Fri 29 August 2025 |
22.41 (-0.18%) |
22.32 |
21.92 - 23.21 |
0.6044 times |
Thu 31 July 2025 |
22.45 (-7.95%) |
24.15 |
22.27 - 24.84 |
1.0761 times |
Mon 30 June 2025 |
24.39 (-18.15%) |
29.87 |
21.54 - 31.05 |
2.2695 times |
Fri 30 May 2025 |
29.80 (6.96%) |
27.98 |
25.67 - 35.81 |
1.4216 times |
Wed 30 April 2025 |
27.86 (24.82%) |
22.76 |
20.78 - 27.94 |
1.0513 times |
Mon 31 March 2025 |
22.32 (-10.86%) |
25.26 |
20.73 - 29.80 |
0.9541 times |
Fri 28 February 2025 |
25.04 (-6.91%) |
25.57 |
23.83 - 28.97 |
0.5946 times |
DMA SMA EMA moving averages of Gamestop Corporation GME
DMA (daily moving average) of Gamestop Corporation GME
| DMA period | DMA value | | 5 day DMA | 22.86 | | 12 day DMA | 21.54 | | 20 day DMA | 21.39 | | 35 day DMA | 22.02 | | 50 day DMA | 23.13 | | 100 day DMA | 23.25 | | 150 day DMA | 24.46 | | 200 day DMA | 24.56 | EMA (exponential moving average) of Gamestop Corporation GME
| EMA period | EMA current | EMA prev | EMA prev2 | | 5 day EMA | 22.69 | 22.55 | 22.22 | | 12 day EMA | 22.07 | 21.91 | 21.67 | | 20 day EMA | 21.98 | 21.88 | 21.74 | | 35 day EMA | 22.53 | 22.5 | 22.46 | | 50 day EMA | 23.35 | 23.36 | 23.37 |
SMA (simple moving average) of Gamestop Corporation GME
| SMA period | SMA current | SMA prev | SMA prev2 | | 5 day SMA | 22.86 | 22.6 | 22.17 | | 12 day SMA | 21.54 | 21.34 | 21.12 | | 20 day SMA | 21.39 | 21.34 | 21.28 | | 35 day SMA | 22.02 | 22.03 | 22.03 | | 50 day SMA | 23.13 | 23.2 | 23.25 | | 100 day SMA | 23.25 | 23.25 | 23.25 | | 150 day SMA | 24.46 | 24.49 | 24.52 | | 200 day SMA | 24.56 | 24.58 | 24.59 |
|
|
