GeneralMotors GM full analysis,charts,indicators,moving averages,SMA,DMA,EMA,ADX,MACD,RSIGeneral Motors GM WideScreen charts, DMA,SMA,EMA technical analysis, forecast prediction, by indicators ADX,MACD,RSI,CCI NYSE stock exchange
operates under Capital Goods sector & deals in Auto Manufacturing
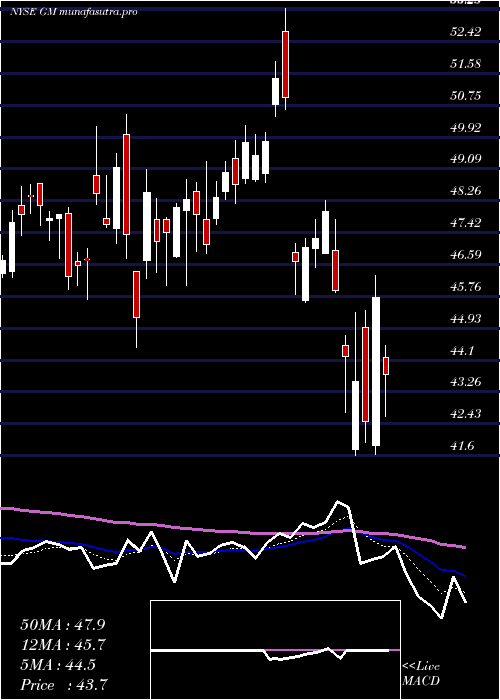
Daily price and charts and targets GeneralMotors Strong Daily Stock price targets for GeneralMotors GM are 75.53 and 77.53 | Daily Target 1 | 74.02 | | Daily Target 2 | 75.03 | | Daily Target 3 | 76.016666666667 | | Daily Target 4 | 77.03 | | Daily Target 5 | 78.02 |
Daily price and volume General Motors
| Date |
Closing |
Open |
Range |
Volume |
Fri 05 December 2025 |
76.05 (1.01%) |
75.08 |
75.00 - 77.00 |
1.1373 times |
Thu 04 December 2025 |
75.29 (0.8%) |
75.00 |
74.90 - 76.22 |
1.6328 times |
Wed 03 December 2025 |
74.69 (1.4%) |
73.61 |
73.61 - 74.92 |
1.0824 times |
Tue 02 December 2025 |
73.66 (0.97%) |
73.15 |
72.09 - 73.84 |
1.1574 times |
Mon 01 December 2025 |
72.95 (-0.78%) |
73.09 |
72.91 - 73.93 |
1.2673 times |
Fri 28 November 2025 |
73.52 (0.96%) |
72.94 |
72.91 - 73.86 |
0.4843 times |
Wed 26 November 2025 |
72.82 (0.07%) |
72.80 |
72.22 - 73.45 |
0.5556 times |
Tue 25 November 2025 |
72.77 (2.52%) |
70.90 |
70.90 - 73.11 |
0.7026 times |
Mon 24 November 2025 |
70.98 (0.92%) |
70.82 |
70.25 - 71.37 |
0.581 times |
Fri 21 November 2025 |
70.33 (3.37%) |
68.29 |
68.19 - 70.53 |
1.3992 times |
Thu 20 November 2025 |
68.04 (-0.67%) |
68.94 |
67.78 - 69.89 |
1.2105 times |
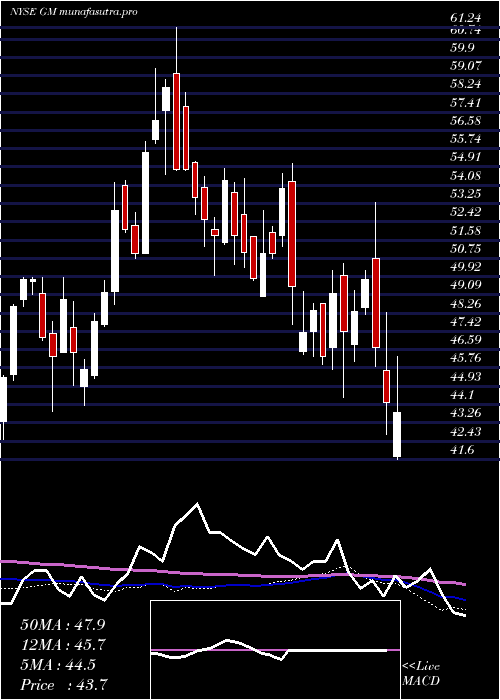
Weekly price and charts GeneralMotors Strong weekly Stock price targets for GeneralMotors GM are 74.07 and 78.98 | Weekly Target 1 | 70.14 | | Weekly Target 2 | 73.09 | | Weekly Target 3 | 75.046666666667 | | Weekly Target 4 | 78 | | Weekly Target 5 | 79.96 |
Weekly price and volumes for General Motors
| Date |
Closing |
Open |
Range |
Volume |
Fri 05 December 2025 |
76.05 (3.44%) |
73.09 |
72.09 - 77.00 |
1.3596 times |
Fri 28 November 2025 |
73.52 (4.54%) |
70.82 |
70.25 - 73.86 |
0.5032 times |
Fri 21 November 2025 |
70.33 (-0.27%) |
70.31 |
67.06 - 70.53 |
1.2547 times |
Fri 14 November 2025 |
70.52 (-0.33%) |
71.00 |
69.87 - 72.87 |
1.0264 times |
Fri 07 November 2025 |
70.75 (2.4%) |
67.45 |
66.75 - 70.76 |
0.6482 times |
Fri 31 October 2025 |
69.09 (0%) |
68.78 |
68.63 - 69.32 |
0.1954 times |
Fri 31 October 2025 |
69.09 (-0.83%) |
69.57 |
68.39 - 70.24 |
1.3388 times |
Fri 24 October 2025 |
69.67 (19.34%) |
58.37 |
57.68 - 69.70 |
2.2069 times |
Fri 17 October 2025 |
58.38 (1.96%) |
55.90 |
54.33 - 59.17 |
0.9775 times |
Tue 07 October 2025 |
57.26 (-5.28%) |
60.19 |
56.63 - 60.45 |
0.4893 times |
Fri 03 October 2025 |
60.45 (-1.29%) |
61.85 |
58.67 - 62.14 |
1.1901 times |
Monthly price and charts GeneralMotors Strong monthly Stock price targets for GeneralMotors GM are 74.07 and 78.98 | Monthly Target 1 | 70.14 | | Monthly Target 2 | 73.09 | | Monthly Target 3 | 75.046666666667 | | Monthly Target 4 | 78 | | Monthly Target 5 | 79.96 |
Monthly price and volumes General Motors
| Date |
Closing |
Open |
Range |
Volume |
Fri 05 December 2025 |
76.05 (3.44%) |
73.09 |
72.09 - 77.00 |
0.25 times |
Fri 28 November 2025 |
73.52 (6.41%) |
67.45 |
66.75 - 73.86 |
0.6312 times |
Fri 31 October 2025 |
69.09 (13.32%) |
60.94 |
54.33 - 70.24 |
1.0905 times |
Tue 30 September 2025 |
60.97 (4.06%) |
57.54 |
56.61 - 62.14 |
0.8017 times |
Fri 29 August 2025 |
58.59 (9.84%) |
52.15 |
51.88 - 59.23 |
0.7052 times |
Thu 31 July 2025 |
53.34 (8.39%) |
48.82 |
48.80 - 54.71 |
1.1861 times |
Mon 30 June 2025 |
49.21 (-0.81%) |
49.10 |
46.82 - 50.40 |
0.9974 times |
Fri 30 May 2025 |
49.61 (9.66%) |
46.50 |
44.72 - 50.81 |
1.0358 times |
Wed 30 April 2025 |
45.24 (-3.81%) |
47.01 |
41.60 - 48.27 |
1.5347 times |
Mon 31 March 2025 |
47.03 (-4.27%) |
49.98 |
44.41 - 53.29 |
1.7673 times |
Fri 28 February 2025 |
49.13 (-0.67%) |
46.50 |
45.69 - 50.19 |
1.0461 times |
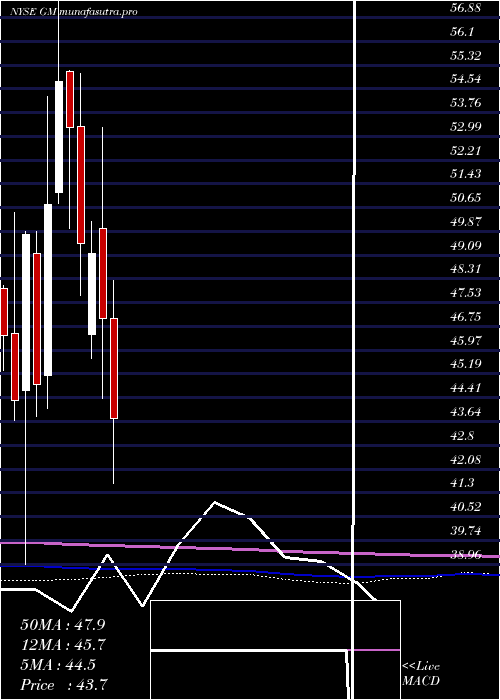
DMA SMA EMA moving averages of General Motors GM
DMA (daily moving average) of General Motors GM
| DMA period | DMA value | | 5 day DMA | 74.53 | | 12 day DMA | 72.47 | | 20 day DMA | 71.64 | | 35 day DMA | 69.69 | | 50 day DMA | 66.53 | | 100 day DMA | 61.18 | | 150 day DMA | 57.12 | | 200 day DMA | 54.55 | EMA (exponential moving average) of General Motors GM
| EMA period | EMA current | EMA prev | EMA prev2 | | 5 day EMA | 74.72 | 74.06 | 73.45 | | 12 day EMA | 73.11 | 72.57 | 72.08 | | 20 day EMA | 71.75 | 71.3 | 70.88 | | 35 day EMA | 69.12 | 68.71 | 68.32 | | 50 day EMA | 66.71 | 66.33 | 65.96 |
SMA (simple moving average) of General Motors GM
| SMA period | SMA current | SMA prev | SMA prev2 | | 5 day SMA | 74.53 | 74.02 | 73.53 | | 12 day SMA | 72.47 | 71.79 | 71.18 | | 20 day SMA | 71.64 | 71.28 | 70.95 | | 35 day SMA | 69.69 | 69.16 | 68.66 | | 50 day SMA | 66.53 | 66.18 | 65.86 | | 100 day SMA | 61.18 | 60.95 | 60.73 | | 150 day SMA | 57.12 | 56.93 | 56.74 | | 200 day SMA | 54.55 | 54.41 | 54.27 |
|
|
